
Summary
Background
In December 2025 to January 2026, the Local Government Association distributed an online survey to chief financial officers of English councils. The purpose of the survey was to gauge councils’ financial positions in preparing their budgets for the 2026/27 financial year. It covered a range of topics such as meeting statutory responsibilities, likelihood of applying for exceptional financial support (EFS), dedicated schools grant deficits (DSG) related to special educational needs and disabilities (SEND) and issues related to pay and housing revenue accounts (HRAs). Responses were received on behalf of 154 councils – a response rate of 49 per cent.
Timescales
The survey was launched on 17 December 2025, immediately following the publication of the provisional local government finance settlement on the same day. It was closed on 16 January 2026, before the final local government finance settlement on 9 February. The survey was also closed before the Government’s announcement of a 90 per cent write-off of historic dedicated schools grant (DSG) deficits, which accompanied the final settlement on 9 February. The survey was thus also closed before the Government’s announcement on 28 January 2026 of rent convergence being introduced at a rate of £1 per week in 2027/28 and £2 per week from 2028/29 onwards. As such, the questions and responses are framed from a position of unawareness of the content of the final settlement and the announced measures with respect to DSG deficits and rent convergence, although these topics were featured in the survey on a hypothetical basis.
Key findings
Financial overview
A majority (58 per cent) of respondents, and 69 per cent representing social care councils, said it would be very or fairly difficult to set a balanced budget for the 2026/27 financial year.
- Almost one-sixth of all responding councils (16 per cent) lacked confidence that they would have sufficient funding to fulfil all statutory duties in 2026/27, rising to 51 per cent by 2028/29.
- Over two-thirds (68 per cent) of single-tier and county council respondents were not confident in having enough funding to fulfil their statutory duties in at least one of the three following financial years.
The Fair Funding Review 2.0 and the provisional local government financial settlement
- Over half (58 per cent) of respondents thought that the reallocation of funding via the Fair Funding Review 2.0 would make their council’s finances weaker during the same period.
Exceptional financial support
- Just over a third (34 per cent), and almost half of social care councils (47 per cent), had already applied for EFS or in 2026/27 or were likely to apply at least once in the two subsequent years.
- A large majority (91 per cent) of those who had already applied for EFS for 2025/26 had also applied for EFS or were likely to at least once during the following three financial years.
- Two-fifths (40 per cent) were more likely to apply for EFS following the Fair Funding Review 2.0 for at least one of the next three financial years.
- Among those who had already received EFS at least once between 2022/23 and 2025/26, approximately 77 per cent of the capitalisation required for this support was accounted for through borrowing as opposed to capital receipts, increasing from 50 per cent in 2022/23 to 84 per cent in 2025/26.
- A large majority (89 per cent, or 17 of 19 councils) of those who had already received EFS during this time thought that capitalisations were not effective in returning councils to financial stability on a timely basis.
Dedicated schools grant deficits
It should be noted that the survey was closed before the Government announcement on 9 February that 90 per cent of historic DSG deficits will be written off.
- A significant majority (79 per cent) said that, if the statutory override on the treatment of DSG deficits ends as planned in March 2028 without a suitable alternative method for addressing the overspends in these services, their council would not be able to set a balanced budget for the 2028/29 financial year.
- A very large majority (95 per cent) of single-tier and county councils had a DSG deficit at the time of answering the survey.
- A very large majority (94 per cent) said that, assuming that they no longer have a DSG deficit by 1 April 2028, but that the SEND system remains unreformed, they would continue to overspend their SEND budget.
- A significant majority (77 per cent) said that direct treasury management costs created by their DSG deficit would have a significant or moderate negative impact on their council’s budget setting for 2026/27.
Housing revenue accounts
- Almost all responding councils with a HRA (99 per cent) said they were likely to raise rents for the 2026/27 financial year, whilst 49 per cent were likely to reduce capital expenditure on existing stock and 46 per cent were likely to draw down on reserves in this year.
- A quarter (25 per cent) were not confident they would be able to balance their annual HRA budget, and over half (51 per cent) were not confident they would be able to invest in planned new build programmes, over the next five financial years under the Government’s 10-year social housing rent settlement of the Consumer Price Index (CPI) plus 1 per cent, but without the introduction of rent convergence.
- The introduction of rent convergence of £2 per week from 2026/27 would have increased confidence to 80 per cent for balancing budgets and 59 per cent for investing in planned new build programmes.
Introduction
In December 2025 to January 2026, the Local Government Association (LGA) distributed an online survey to the chief financial officers of English councils. The purpose of the survey was: to assess the financial position of councils in setting their budgets for the 2026/27 financial year; to gauge the likelihood of councils to need to apply for exceptional financial support (EFS); and to explore councils’ positions on a range of other financial topics, such as dedicated schools grant (DSG) deficits related to special educational needs and disabilities (SEND) and issues relating to pay and housing revenue accounts (HRAs).
Methodology
On 17 December 2025, the LGA’s Research and Information Team sent an online survey to the chief financial officer of every principal council in England, with the exception of two councils which were not currently in LGA membership. This immediately followed the publication of the provisional local government finance settlement on the same day. The survey was in the field for about a month and closed on Friday 16 January.
It should be noted that the questionnaire for the survey was designed based on the LGA’s knowledge of the local government financial landscape as of 17 December 2025, and responding councils’ answers were based on their own knowledge of their councils and the wider sector up to 16 January. As such, the following subsequent developments did not influence the design or results of the survey:
- The Government’s announcement that rent convergence will be introduced at a rate of £1 per week throughout 2027/28, rising to £2 per week from 2028/29 onwards, on 28 January 2026.
- The publication of the final local government finance settlement on 9 February 2026.
- The Government’s announcement of a 90 per cent write-off of historic dedicated schools grant (DSG) deficits, which accompanied the release of the final settlement on 9 February.
These topics were covered in the survey on a hypothetical basis, without final knowledge of the confirmed changes at the time of completion.
Of the 315 councils invited to respond to the survey, a total of 154 provided a response – a response rate of 49 per cent. Whilst these respondents may not be fully representative of all councils, this level of response means that the results are likely to provide a good indication of the position of the sector more widely.
Table 1 shows a breakdown of response rates by council type, showing that the council type with the lowest level of response was district councils, with 41 per cent responding, whilst the council type with the highest level of response was county councils, with 90 per cent responding.
Table 2 shows a breakdown of response rates by region, showing that the region with the lowest level of response was the Eastern region, with 40 per cent responding, whilst the region with the highest level of response was the North East, with 67 per cent responding.
Table 1: Response rate by type of council
| Type of council |
Number of questionnaires |
Number of responses |
Response rate |
|---|---|---|---|
| District |
164 |
67 |
41% |
| County |
20 |
18 |
90% |
| London borough |
32 |
16 |
50% |
| Metropolitan district |
36 |
19 |
53% |
| Unitary |
63 |
34 |
54% |
Table 2: Response rate by region
| Region |
Number of questionnaires |
Number of responses |
Response rate |
|---|---|---|---|
| Eastern |
50 |
20 |
40% |
| East Midlands |
38 |
18 |
47% |
| London |
32 |
16 |
50% |
| North East |
12 |
8 |
67% |
| North West |
36 |
16 |
44% |
| South East |
70 |
37 |
53% |
| South West |
29 |
15 |
52% |
| West Midlands |
33 |
15 |
45% |
| Yorkshire and Humber |
15 |
9 |
60% |
In addition, the following should be considered when interpreting the findings of this survey:
- When making comparisons in the results between council types, councils have been grouped into single-tier and county councils, consisting of county councils, London boroughs, metropolitan districts and unitary authorities, compared with district councils. Whilst county councils have important differences from single-tier councils, they share responsibilities for social care and education, which constitute key financial pressures at the current time. In addition, the small number of county councils would make isolated figures based on this council type unreliable.
- Throughout this report, respondents to the survey may be referred to by the councils they represent for the sake of brevity. For example, the phrases ‘20 per cent of respondents representing district councils’, ’20 per cent of district council respondents’, ’20 per cent of responding district councils’, ’20 per cent of district councils’ and ’20 per cent of districts’ should be regarded as interchangeable in meaning.
- Many of the councils represented by the survey respondents will be reorganised in future years. In these cases, respondents were asked to answer questions regarding their council’s finances in these future periods as if their council would continue to exist in its present form.
- Where tables and figures report the base, the description refers to the group of people who were asked the question. Please note that bases can vary throughout the survey.
- Numbers and percentages are provided for any questions where the base was less than 50. To calculate the number of respondents who provided a certain response for other questions, simply multiply the percentage provided by the base.
- Throughout the report, percentages may not appear to add up to exactly as expected due to rounding.
Council budget setting 2026/27
This section contains analysis of the full results from the survey.
Financial overview
Difficulty setting a balanced budget for 2026/27
Respondents were asked to assess how difficult or not it would be for their council to set a balanced budget for the 2026/27 financial year, following the Provisional Local Government Financial Settlement (PLGFS) and Autumn Budget.
Table 3 shows the results for this question, both overall and for district and single-tier and county councils separately. This shows that a total of 58 per cent of respondents said it would be difficult to set a balanced budget for 2026/27, of which 23 per cent said it would be ‘very difficult’ and 35 per cent said it would be ‘fairly difficult’. Whilst a significant proportion of district council respondents (45 per cent) said it would be difficult to set a balanced budget, the proportion of single-tier and county councils saying this was substantially higher, at 69 per cent, which also included a far higher proportion saying that setting a balanced budget would be ‘very difficult’ (36 per cent compared to 7 per cent). Only 3 per cent of single tier and county council respondents said that setting a balanced budget for 2026/27 would be ‘not at all difficult’, compared with 10 per cent overall and 19 per cent of districts.
Table 3: How difficult or not will it be for your council to set a balanced budget for the 2026/27 financial year?
|
Total |
District |
Single-tier and county |
|
|---|---|---|---|
| Total – difficult |
58% |
45% |
69% |
| Very difficult |
23% |
7% |
36% |
| Fairly difficult |
35% |
37% |
33% |
| Not very difficult |
31% |
36% |
28% |
| Not at all difficult |
10% |
19% |
3% |
| Don’t know |
0% |
0% |
0% |
Base: all respondents (154 total, 67 districts, 87 single-tier and counties).
Confidence in meeting statutory duties
Respondents were asked how confident or not they were that their council would have sufficient funding to fulfil all its statutory duties in each of the three financial years 2026/27, 2027/28, and 2028/29.
Table 4 Figure 1 provide the overall results for this question, showing that 84 per cent of respondents were confident of their council being able to fulfil its statutory duties in 2026/27, compared with 63 per cent in 2027/28 and 43 per cent in 2028/29. The most pronounced decline across this period was in those saying ‘very confident’, which fell from 43 per cent in 2026/27 to 18 per cent in 2027/28 and 10 per cent in 2028/29. The percentage that was ‘not at all confident’ rose from 9 per cent in 2026/27 to 17 per cent in 2027/28 and 25 per cent in 2028/29. Over half (51 per cent) of respondents were not confident their council would have sufficient funding to fulfil all its statutory duties in 2028/29.
Table 4: How confident or not are you that your council will have sufficient funding to fulfil all your statutory duties in each of the three financial years from 2026/27 to 2028/29?
|
2026/27 |
2027/28 |
2028/29 |
|
|---|---|---|---|
| Total – confident |
84% |
63% |
43% |
| Very confident |
43% |
18% |
10% |
| Fairly confident |
41% |
45% |
33% |
| Not very confident |
7% |
20% |
25% |
| Not at all confident |
9% |
17% |
25% |
| Total – not confident |
16% |
37% |
51% |
| Don’t know |
0% |
0% |
6% |
Base: all respondents (154).
Figure 1. Confidence in fulfilling all statutory duties
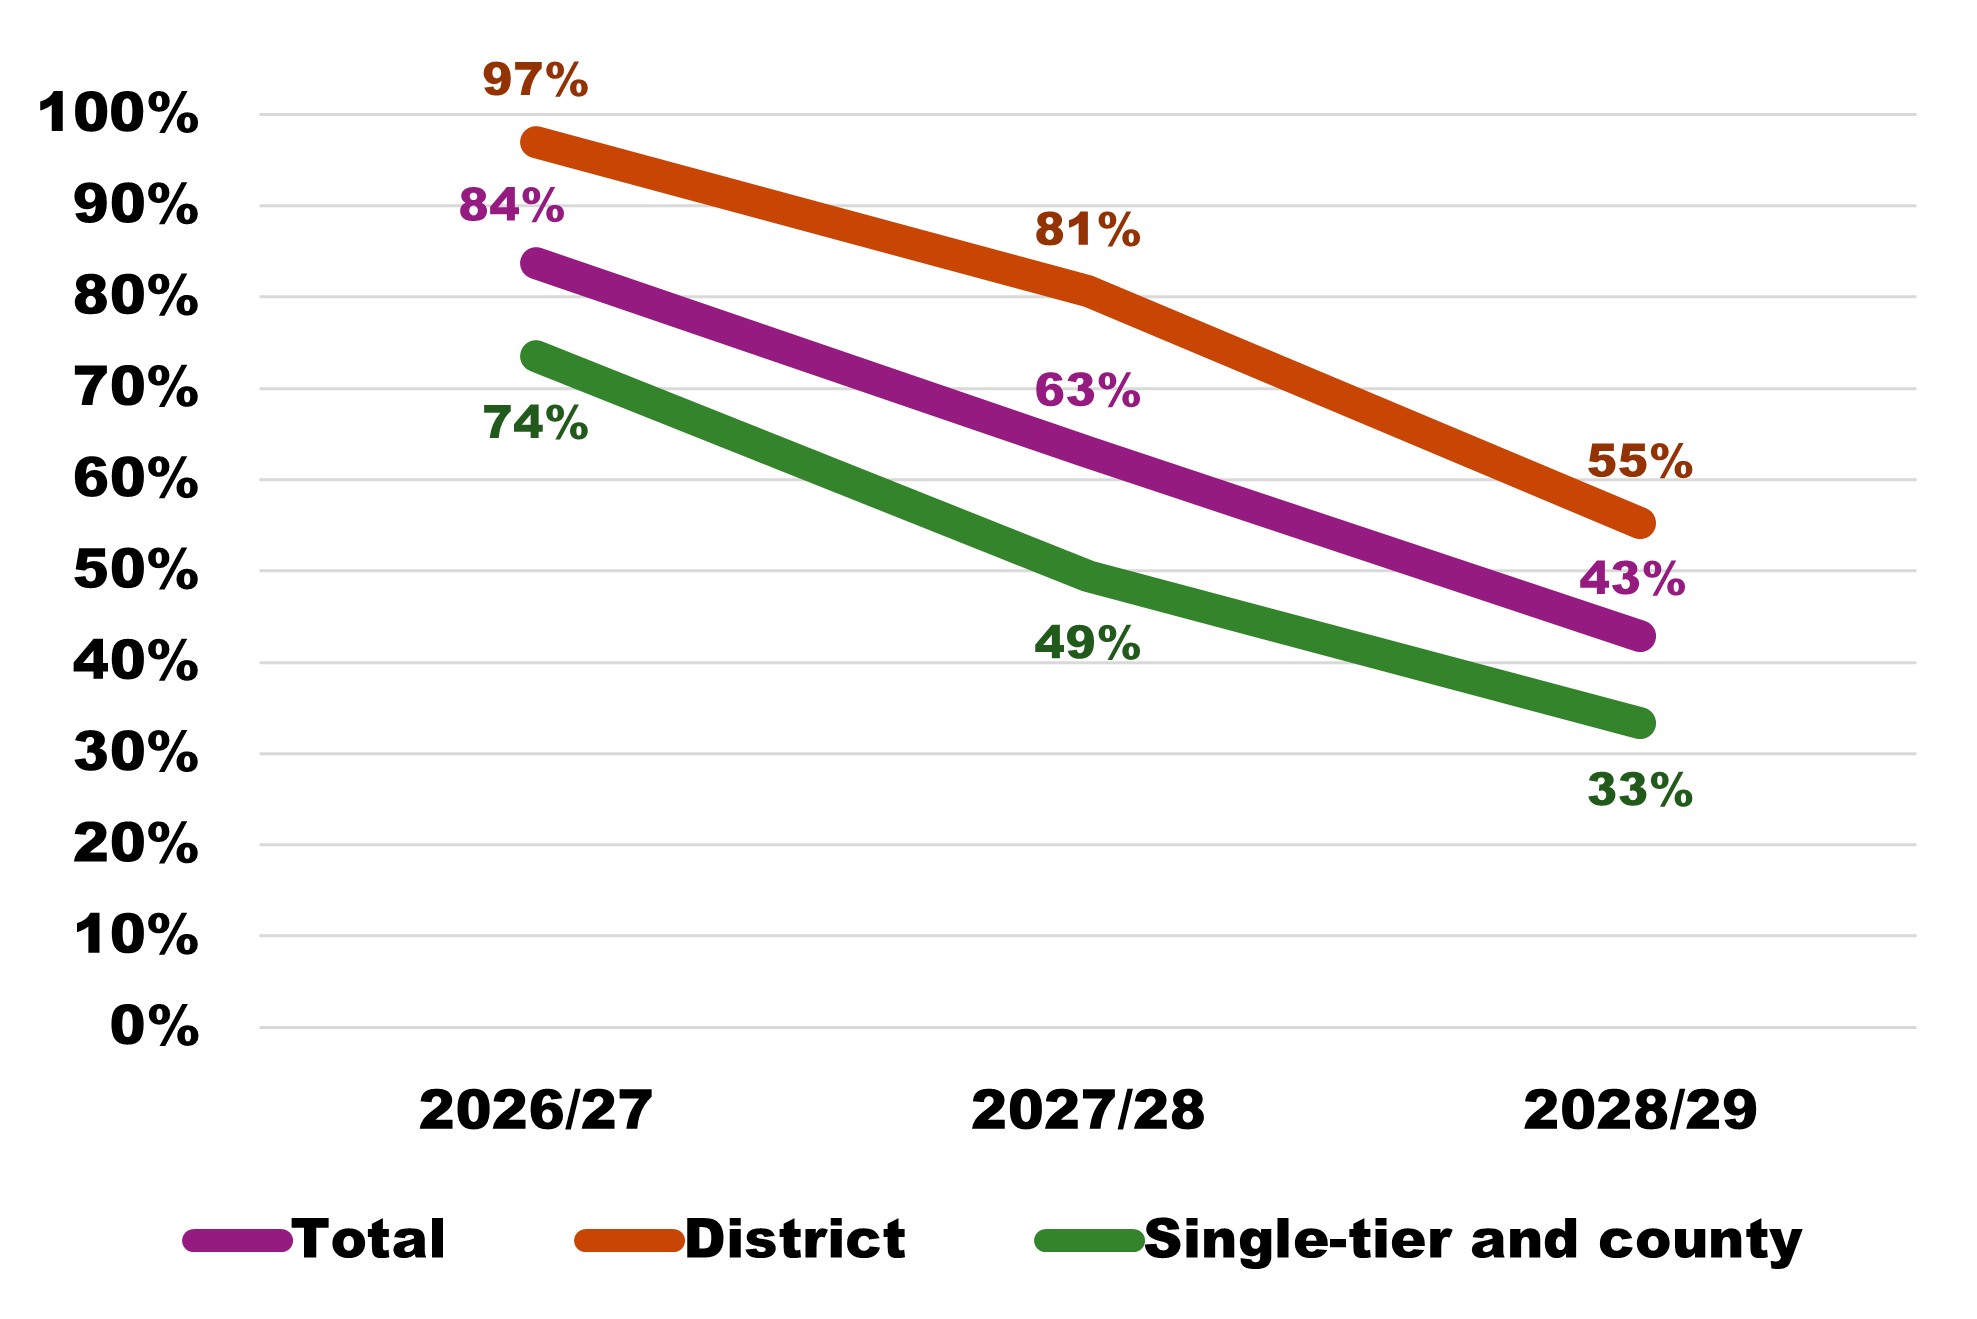
Table 5 and Table 6 show the results for this question for respondents representing district councils and those representing single-tier and county councils respectively. These show that significant numbers of respondents from all council types lacked confidence in meeting statutory duties, particularly for 2027/28 and 2028/29, but that confidence was lowest among single-tier and county council respondents. Almost all (97 per cent) respondents representing district councils were very or fairly confident in meeting 2026/27 statutory duties, compared with just under three-quarters (74 per cent) of those representing single-tier and county councils. Confidence was 81 per cent among districts and 49 per cent among single-tier and county councils for 2027/28, and for 2028/29 it was 55 per cent among districts and 33 per cent among single-tier and county councils. Among districts, the percentage that were not confident in meeting statutory duties rose from 3 per cent in 2026/27 to 19 per cent for 2027/28 and 31 per cent for 2028/29. For single-tier and county councils, this percentage was much higher in 2026/27, at 26 per cent, rising to over half (51 per cent) for 2027/28 and almost two-thirds (66 per cent) for 2028/29.
Table 5: Confidence in meeting statutory duties for district council respondents
|
2026/27 |
2027/28 |
2028/29 |
|
|---|---|---|---|
| Total – confident |
97% |
81% |
55% |
| Very confident |
57% |
36% |
18% |
| Fairly confident |
40% |
45% |
37% |
| Not very confident |
1% |
9% |
13% |
| Not at all confident |
1% |
10% |
18% |
| Total – not confident |
3% |
19% |
31% |
| Don’t know |
0% |
0% |
13% |
Base: all district council respondents (67).
Table 6: Confidence in meeting statutory duties for single-tier and county council respondents
|
2026/27 |
2027/28 |
2028/29 |
|
|---|---|---|---|
| Total – confident |
74% |
49% |
33% |
| Very confident |
32% |
3% |
3% |
| Fairly confident |
41% |
46% |
30% |
| Not very confident |
11% |
29% |
34% |
| Not at all confident |
15% |
22% |
31% |
| Total – not confident |
26% |
51% |
66% |
| Don’t know |
0% |
0% |
1% |
Base: all single-tier and county respondents (87).
Councils were classified based on whether they answered ‘not very confident’ or ‘not at all confident’ for at least one year during the three financial year period. This equates to a measure of the proportion of councils that are not confident in fulfilling all their statutory duties for the entirety of this period. Table 7 shows the proportion of respondents meeting this criterion, showing that over half (54 per cent) of respondents were not confident about their council fulfilling all its statutory duties in at least one of the financial years 2026/27 to 2028/29. This figure was slightly lower among districts, but still well over a third (36 per cent), but significantly higher among single-tier and county councils, at over two-thirds (68 per cent).
Table 7: Councils not confident in fulfilling statutory duties in one or more of the financial years 2026/27 to 2028/29
|
Per cent |
|
|---|---|
| Total |
54% |
| District |
36% |
| Single-tier and county |
68% |
Base: all respondents (154 total, 67 districts, 87 single-tier and counties).
The Fair Funding Review and the provisional local government financial settlement
Reallocation of funding
Respondents were asked whether, compared to the allocation of funding used for 2025/26, the reallocation of funding via the Fair Funding Review 2.0 would make their council’s finances stronger or weaker over the 2026/27 to 2028/29 period.
Table 8 shows the results for this question, demonstrating that just under a third of respondents (32 per cent) anticipated having a stronger financial position as a result of the Fair Funding Review 2.0 compared with 2025/26 funding allocations, whilst 10 per cent anticipated their finances being about the same and 58 per cent anticipated having a weaker financial position. District councils tended to anticipate a stronger financial position less frequently (28 per cent, compared to 34 per cent of single-tier and county councils), and to anticipate a weaker financial position more frequently (64 per cent, compared to 53 per cent of single-tier and county councils). Nevertheless, a majority of councils of both types anticipated a weaker financial position as a result of the Review.
Table 8: Compared to the allocation of funding used for 2025/26, do you think the reallocation of funding via the Fair Funding Review 2.0 will make your council's finances stronger or weaker over the period 2026/27 to 2028/29?
|
Total |
District |
Single-tier and county |
|
|---|---|---|---|
| Total – stronger |
32% |
28% |
34% |
| Significantly stronger |
6% |
6% |
7% |
| Somewhat stronger |
25% |
22% |
28% |
| About the same |
10% |
7% |
13% |
| Somewhat weaker |
19% |
30% |
11% |
| Significantly weaker |
38% |
34% |
41% |
| Total – weaker |
58% |
64% |
53% |
| Don’t know |
0% |
0% |
0% |
Base: all respondents (154 total, 67 districts, 87 single-tier and counties).
Table 9 shows a comparison of responses to the previous question on confidence in delivering statutory duties with the question on the financial impact of the Fair Funding Review 2.0. It provides the percentage of those within each level of impact from the Review (with ‘stronger’ and ‘weaker’ categories combined) who had said they were not confident that their council could fulfil its statutory duties in one or more of the financial years 2026/27 to 2028/29. This demonstrated that a lack of confidence in meeting statutory duties was significantly higher among those with weaker finances following the Fair Funding Review 2.0, at 70 per cent of all responding councils, 51 per cent of districts and 87 per cent of single-tier and county councils. However, a substantial proportion of those with stronger finances following the Review were nevertheless not confident in meeting their statutory duties in coming financial years (24 per cent overall, 5 per cent of district councils and 37 per cent of single-tier and county councils).
Table 9: Lack of confidence in delivering statutory duties up to and including 2028/29 broken down by financial impact of the Fair Funding Review 2.0
|
Total |
District |
Single-tier and county |
|
|---|---|---|---|
| Stronger finances |
24% |
5% |
37% |
| About the same |
56% |
20% |
73% |
| Weaker finances |
70% |
51% |
87% |
| All |
54% |
36% |
68% |
Base: all respondents who provided the relevant response to the question on the impact of the Fair Funding Review 2.0 (total: 154, 49 ‘stronger’, 16 ‘about the same’, 89 ‘weaker’; district: 67, 19 ‘stronger’, 5 ‘about the same’, 43 ‘weaker’; single-tier and county: 87, 30 ‘stronger’, 11 ‘about the same’, 46 ‘weaker’).
Meeting cost and demand pressures
Respondents were asked how confident or not they were that their council could meet expected cost and demand pressures as set out in their medium-term financial plan over the three years of the Spending Review period (2026/27 to 2028/29), following the outcome of the Fair Funding Review 2.0.
Table 10 shows the results for this question, demonstrating that confidence and lack of confidence in meeting cost and demand pressures was evenly distributed across the respondents overall, with 49 per cent expressing confidence and 49 per cent expressing a lack of confidence. Nevertheless, the proportion responding ‘very confident’ was significantly lower than the proportion responding ‘not at all confident’ (4 per cent compared to 23 per cent). Levels of confidence were significantly divided by council type: 69 per cent of district councils were confident of meeting expected cost and demand pressures across the Spending Review period, whilst 63 per cent of single-tier and county councils were not confident of meeting these pressures. No single-tier and county councils were ‘very confident’ in meeting the pressures, and almost a third (32 per cent) said they were ‘not at all confident’.
Table 10: Following the outcome of the Fair Funding Review 2.0, how confident or not are you that your council can meet expected cost and demand pressures as set out in your medium-term financial plan over the three years of the Spending Review period (from 2026/27 to 2028/29)?
|
Total |
District |
Single-tier and county |
|
|---|---|---|---|
| Total – confident |
49% |
69% |
34% |
| Very confident |
4% |
9% |
0% |
| Fairly confident |
45% |
60% |
34% |
| Not very confident |
27% |
21% |
31% |
| Not at all confident |
23% |
10% |
32% |
| Total – not confident |
49% |
31% |
63% |
| Don’t know |
1% |
0% |
2% |
Base: all respondents (154 total, 67 districts, 87 single-tier and counties).
Exceptional financial support
Likelihood to apply for retrospective support for 2025/26
Respondents were asked whether their council had already, or was likely to, submit an application for retrospective exceptional financial support (EFS) to support in-year pressures for the 2025/26 financial year, referring to any application for EFS submitted on or after 1 April 2025 to support cost pressures over 2025/26. The responses to this question contained substantial data quality issues suggesting it may have been misinterpreted by a substantial number of respondents, who may have thought it referred to any application for pressures within the 2025/26 financial year regardless of when the application was submitted. As such, the results of this question have not been presented.
Likelihood to apply for EFS for future years
Respondents were asked how likely or not it was that their council would apply for EFS to support its budget in future years. As Table and Figure 2 show, around 15 per cent had already applied for EFS to support their budget for 2026/27 or were likely to, whilst this figure was 24 per cent for 2027/28 and 30 per cent for 2028/29. The proportion of respondents who had already applied was considerably higher for 2026/27 than for subsequent financial years, at 15 per cent, although a small number of respondents said that their council had already applied for EFS to support its budget in 2027/28 and 2028/29. A total of 84 per cent were not likely to apply for EFS to support their budgets in 2026/27, of which the largest group (70 per cent) said they were ‘not at all likely to apply’. This was somewhat lower with regard to 2027/28 budgets, at 70 per cent (and 45 per cent not at all likely to apply), and substantially lower for 2028/29, at 54 per cent (and 30 per cent not at all likely to apply). The share of respondents answering ‘don’t know’ was also notably higher for future financial years, at 1 per cent for 2026/27 budgets, 5 per cent for 2027/28, and 16 per cent for 2028/29.
Table 11: How likely or not is it that your council will apply for EFS to support its budget in future years?
|
2026/27 budget |
2027/28 budget |
2028/29 budget |
|
|---|---|---|---|
| Total – applied for EFS or likely to |
15% |
24% |
30% |
| Have already applied |
15% |
3% |
2% |
| Very likely to apply |
1% |
11% |
12% |
| Fairly likely to apply |
0% |
11% |
16% |
| Not very likely to apply |
15% |
26% |
24% |
| Not at all likely to apply |
70% |
45% |
30% |
| Total – not likely to apply |
84% |
70% |
54% |
| Don’t know |
1% |
5% |
16% |
Base: all respondents who answered the question (151 for 2026/27, 152 for 2027/28, 154 for 2028/29).
Figure 2. Likelihood of applying for EFS in future years
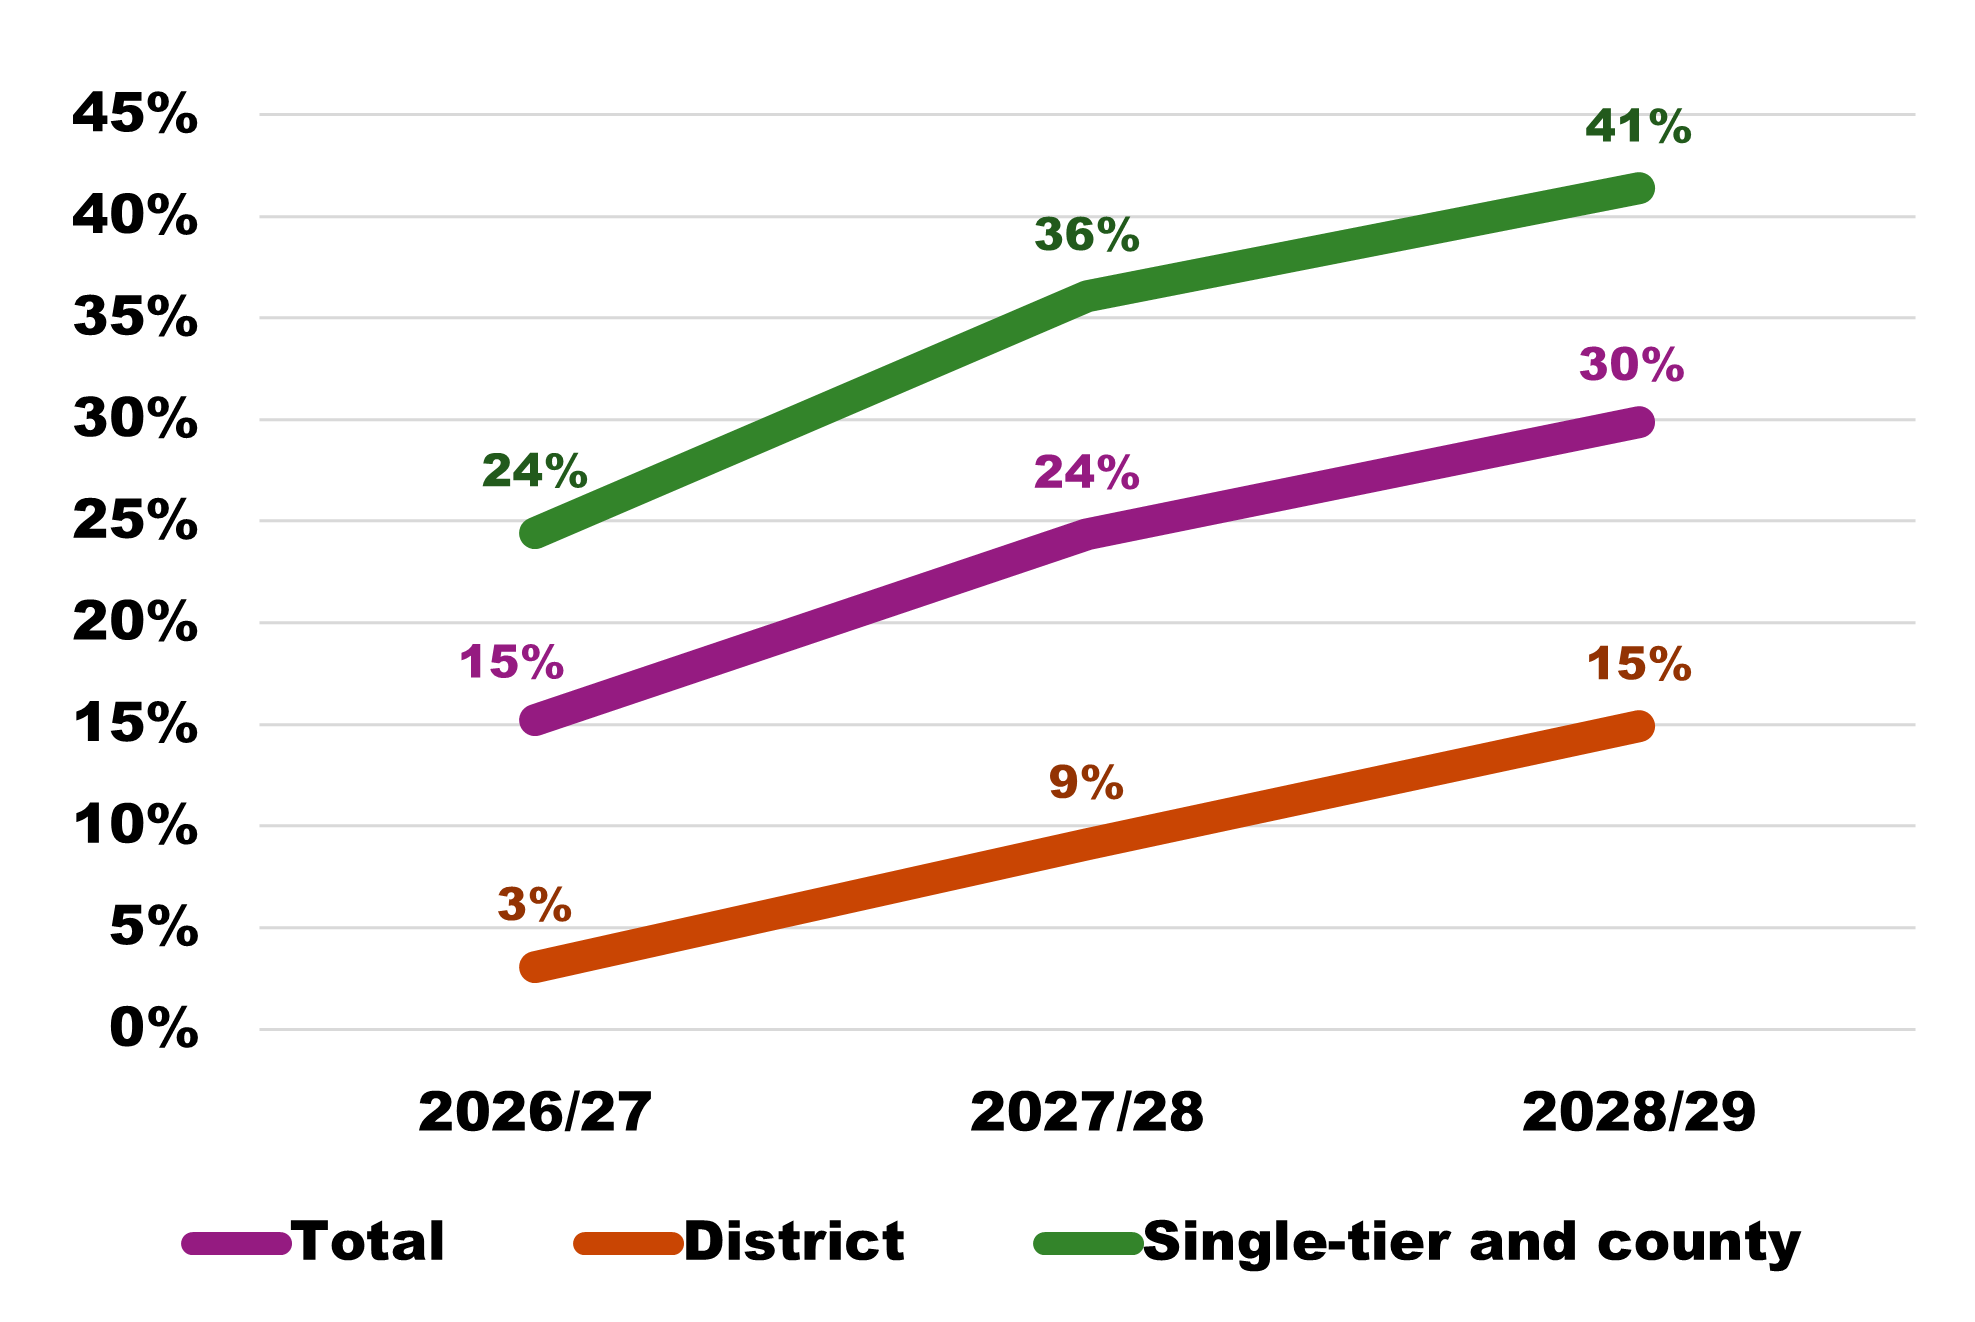
Table 12 and Table 13 show the likelihood to apply for EFS in future years for district council and single-tier and county council respondents separately. These show that likelihood to apply was noticeably higher among single-tier and county councils, with 24 per cent having already applied or being likely to for their 2026/27 budgets, compared to 36 per cent for 2027/28 and over two-fifths (41 per cent) for 2028/29. Almost a quarter of responding single-tier and county councils (23 per cent) had already applied for EFS to support their 2026/27 budget, and less than half (46 per cent) were not likely to apply for EFS to support their 2028/29 budget. Nevertheless, a significant minority of responding district councils had already applied for EFS or were likely to for this period, rising to 15 per cent for 2028/29.
Table 12: Likelihood to apply for EFS for future years for district council respondents
|
2026/27 budget |
2027/28 budget |
2028/29 budget |
|
|---|---|---|---|
| Total – applied for EFS or likely to |
3% |
9% |
15% |
| Have already applied |
3% |
0% |
0% |
| Very likely to apply |
0% |
6% |
6% |
| Fairly likely to apply |
0% |
3% |
9% |
| Not very likely to apply |
9% |
23% |
22% |
| Not at all likely to apply |
88% |
62% |
42% |
| Total – not likely to apply |
97% |
85% |
64% |
| Don’t know |
0% |
6% |
21% |
Base: all respondents who answered the question (65 for 2026/27, 66 for 2027/28, 67 for 2028/29).
Table 13: Likelihood to apply for EFS for future years for single-tier and county council respondents
|
2026/27 budget |
2027/28 budget |
2028/29 budget |
|
|---|---|---|---|
| Total – applied for EFS or likely to |
24% |
36% |
41% |
| Have already applied |
23% |
5% |
3% |
| Very likely to apply |
1% |
15% |
17% |
| Fairly likely to apply |
0% |
16% |
21% |
| Not very likely to apply |
19% |
28% |
25% |
| Not at all likely to apply |
56% |
31% |
21% |
| Total – not likely to apply |
74% |
59% |
46% |
| Don’t know |
1% |
5% |
13% |
Base: all respondents who answered the question (86 for 2026/27 and 2027/28, 87 for 2028/29).
Table 14 shows the proportion of respondents who indicated that their council had already applied for EFS, or was very or fairly likely to, to support their budget in at least one of the financial years 2026/27, 2027/28, and/or 2028/29. This demonstrates that over a third (34 per cent) had already applied for EFS or were likely to at least once in the next three financial years. This figure was highest among single-tier and county councils, with almost half (47 per cent) having already applied for EFS or likely to in this period, but this also applied for a substantial number of district councils – almost a sixth (16 per cent).
Table 14: Councils already applied for EFS, or likely to, for at least one of the financial years 2026/27 to 2028/29
|
Per cent |
|
|---|---|
| Total |
34% |
| District |
16% |
| Single-tier and county |
47% |
Base: all respondents (154 total, 67 districts, 87 single-tier and counties).
Elements of 2026/27 EFS applied for
All respondents who indicated that their council had already applied for EFS, or was likely to do so, to support its 2026/27 budget, were asked which elements it was likely to apply for. Respondents were able to select either or both of capitalisation direction and a council tax rate uplift above the referendum threshold. Table 15 shows the results for this question, demonstrating that 91 per cent were likely to apply for capitalisation direction, and 30 per cent were likely to apply for a council tax rate uplift. These options largely overlapped among individual respondents, although two (9 per cent) said their council was likely to apply for a council tax rate uplift but not a capitalisation direction. All applicable district council respondents said they were only likely to apply for capitalisation direction, whilst 90 per cent of applicable single-tier and county council respondents were likely to apply for capitalisation direction and 33 per cent were likely to apply for a council tax rate uplift – the entirety of respondents who said they were likely to apply for this element of EFS.
Table 15: If your council does apply for EFS in 2026/27, or has already done so, which elements is it likely to apply for?
|
Total |
District |
Single-tier and county |
|
|---|---|---|---|
| Capitalisation direction |
91% |
100% |
90% |
| Council tax rate uplift above referendum threshold |
30% |
0% |
33% |
| Don’t know |
0% |
0% |
0% |
Base: all respondents who indicated their council had already applied for EFS, or was likely to, to support its 2026/27 budget (23).
Impact of the Fair Funding Review on EFS likelihood
Respondents were asked how, if at all, the reallocation of funding via the Fair Funding Review 2.0 affected the likelihood of their council needing to apply for EFS to set its future budgets. For each of the following three financial years, respondents were asked to specify whether this reallocation of funding had made their council more likely to apply for EFS, less likely, or that there had been no change in their likelihood of applying.
Table 16 shows the results for this question, demonstrating that 21 per cent of respondents said that the reallocation of funding had made their council less likely to apply for EFS in 2026/27, whilst 69 per cent had experienced no change in their likelihood of applying for EFS in this year, and 10 per cent said the reallocation had made their council more likely to apply for EFS. This shows that for 2026/27, whilst a large majority had seen no change in likelihood, the impact of the funding reallocation had a slight net negative effect on likelihood to apply for EFS in 2026/27, although this went in the other direction in a significant minority of cases.
However, the overall impact of the Fair Funding Review seemed to swing in the other direction in the following two financial years, with 29 per cent saying the reallocation had made them more likely to apply for EFS in 2027/28 compared with 23 per cent who said it had made them less likely, and 37 per cent saying they were more likely to apply for EFS in 2028/29 as a result of the reallocation compared to 21 per cent less likely. The proportion for whom the reallocation made no change to their likelihood of applying for EFS fell substantially to under half (47 per cent) for 2027/28 and 35 per cent for 2028/29, and the proportion who did not know the effect of the reallocation rose from none for 2026/27 to 7 per cent for 2028/29.
Table 16: How, if at all, has the reallocation of funding via the Fair Funding Review 2.0 affected the likelihood of your council needing to apply for EFS to set its future budgets?
|
2026/27 budget |
2027/28 budget |
2028/29 budget |
|
|---|---|---|---|
| Total – more likely |
10% |
29% |
37% |
| Much more likely |
5% |
10% |
19% |
| More likely |
5% |
19% |
18% |
| No change |
69% |
47% |
35% |
| Less likely |
9% |
12% |
12% |
| Much less likely |
12% |
11% |
9% |
| Total – less likely |
21% |
23% |
21% |
| Don’t know |
0% |
1% |
7% |
Base: all respondents who answered the question (153 for 2026/27, 154 for 2027/28 and 2028/29).
Table 17 and Table 18 show the effect of the Fair Funding Review 2.0 funding reallocation for district and single-tier council respondents separately. These show that these effects on balance tended to reduce the likelihood of district councils applying for EFS in the first two financial years, with 21 per cent saying it made them less likely to apply for EFS for 2026/27 compared to 1 per cent more likely, and 24 per cent less likely to apply for 2027/28 compared to 13 per cent more likely. However, the balance was slightly in favour of greater likelihood to apply for EFS in 2028/29, with 25 per cent saying they were more likely to apply and 18 per cent saying they were less likely.
By contrast, the effect of the reallocation single-tier and county councils was on balance in favour of reduced likelihood only in 2026/27 (16 per cent more likely compared to 21 per cent less likely), and to a small extent, and substantially in favour of increased likelihood in subsequent financial years (41 per cent more likely compared to 23 per cent less likely in 2027/28, and 46 per cent more likely compared to 23 per cent less likely in 2028/29).
Table 17: Effect of the funding reallocation on likelihood of applying for EFS for district council respondents
|
2026/27 budget |
2027/28 budget |
2028/29 budget |
|
|---|---|---|---|
| Total – more likely |
1% |
13% |
25% |
| Much more likely |
0% |
3% |
10% |
| More likely |
1% |
10% |
15% |
| No change |
78% |
63% |
45% |
| Less likely |
7% |
10% |
9% |
| Much less likely |
13% |
13% |
9% |
| Total – less likely |
21% |
24% |
18% |
| Don’t know |
0% |
0% |
12% |
Base: all respondents who answered the question (67).
Table 18: Effect of the funding reallocation on likelihood of applying for EFS for single-tier and county council respondents
|
2026/27 budget |
2027/28 budget |
2028/29 budget |
|
|---|---|---|---|
| Total – more likely |
16% |
41% |
46% |
| Much more likely |
9% |
15% |
25% |
| More likely |
7% |
26% |
21% |
| No change |
63% |
34% |
28% |
| Less likely |
10% |
14% |
14% |
| Much less likely |
10% |
9% |
9% |
| Total – less likely |
21% |
23% |
23% |
| Don’t know |
0% |
1% |
3% |
Base: all respondents who answered the question (86 for 2026/27, 87 for 2027/28 and 2028/29).
Table 19 shows the proportion of respondents who said that the Fair Funding Review 2.0 reallocation of funding had made them more likely to apply for EFS to support their budgets for at least one of the financial years 2026/27, 2027/28 and/or 2028/29. This shows that 40 per cent of respondents said the reallocation of funding had made their council more likely to apply for EFS for one of more of these financial years. This figure was somewhat lower for district councils, but remained over one quarter (27 per cent), and higher for single-tier and county councils, at almost half (49 per cent).
Table 19: Councils more likely to apply for EFS following the Fair Funding Review 2.0 for at least one of the financial years 2026/27 to 2028/29
|
Per cent |
|
|---|---|
| Total |
40% |
| District |
27% |
| Single-tier and county |
49% |
Base: all respondents (154 total, 67 districts, 87 single-tier and counties).
Historic receipt of EFS by financial year
Respondents were asked whether their council had received EFS at any point in the four years from 2022/23 to 2025/26. Table 20 shows the results of this question, demonstrating that a large majority (88 per cent) said that their council had not received at EFS at any point in this period, whilst a significant minority (12 per cent) said that they had. The percentage saying they had received EFS was notably higher among single-tier and county council respondents (18 per cent) than among district council respondents (4 per cent).
Table 20: Has your council received EFS at any point in the four years from 2022/23 to 2025/26?
|
Total |
District |
Single-tier and county |
|
|---|---|---|---|
| Yes |
12% |
4% |
18% |
| No |
88% |
96% |
82% |
| Don’t know |
0% |
0% |
0% |
Base: all respondents (154 total, 67 districts, 87 single-tier and counties).
Balance of capital receipts versus borrowing in EFS capitalisation
Respondents who said their council had received EFS at least once between 2022/23 and 2025/26 were asked to specify the share of their capitalised costs from EFS for each of these years which consisted of borrowing, as opposed to the use of capital receipts. It should be borne in mind that the following calculations are estimates based on a small number of survey responses, and as such they may not be as reliable or representative as other figures in this report.
Table 21 and Table 22 show the results for this question. These demonstrate that with regard to EFS received in 2022/23, equal numbers of respondents accounted for capitalisation entirely through capital receipts and through borrowing (at 18 per cent of respondents each, 50 per cent each excluding those whose councils did not receive EFS in this year or did not know the answer). No respondents indicated accounting for capitalisation through a balance of capital receipts and borrowing in this financial year.
For EFS received in 2023/24, the balance shifted in the direction of borrowing, with 17 per cent using only capital receipts, 8 per cent accounting for approximately 75 to 99 per cent of capitalisation through borrowing, and 25 per cent accounting for capitalisation purely through capital receipts. The distribution of respondents excluding no receipt and don’t knows for 2023/24 was 33 per cent for capital receipts alone, 17 per cent for 75 to 99 per cent of capitalisation through borrowing, and 50 per cent for capitalisation purely through capital receipts.
This trend continued for subsequent financial years, with 13 per cent using only capital receipts in 2024/25, 7 per cent using 50 to 74 per cent borrowing, and 67 per cent using only borrowing (15 per cent, 8 per cent and 77 per cent respectively, excluding no receipt and don’t knows). For EFS received in 2025/26, 6 per cent used only capital receipts, 6 per cent used 25 to 49 per cent borrowing, 17 per cent used 75 to 99 per cent borrowing, and 50 per cent using only borrowing (7 per cent, 7 per cent, 7 per cent, 20 per cent and 60 per cent respectively, excluding no receipt and don’t knows). A greater share of respondents did not receive EFS in earlier years compared to later years, falling from 64 per cent in 2022/23 to 11 per cent in 2025/26. Due to a relatively small number of respondents to this question, these figures have not been broken down by council type.
Table 21: In terms of how you used your capitalised costs from EFS in previous years, what share was borrowing, as opposed to the use of capital receipts? By year of EFS receipt
|
2022/23 |
2023/24 |
2024/25 |
2025/26 |
|
|---|---|---|---|---|
| 0% (none of) capitalisation accounted for through borrowing (all accounted for through capital receipts) |
18% (2) |
17% (2) |
13% (2) |
6% (1) |
| 1-24% of capitalisation accounted for through borrowing |
0% (0) |
0% (0) |
0% (0) |
0% (0) |
| 25-49% of capitalisation accounted for through borrowing |
0% (0) |
0% (0) |
0% (0) |
6% (1) |
| 50-74% of capitalisation accounted for through borrowing |
0% (0) |
0% (0) |
7% (1) |
6% (1) |
| 75-99% of capitalisation accounted for through borrowing |
0% (0) |
8% (1) |
0% (0) |
17% (3) |
| 100% (all of) capitalisation accounted for through borrowing (none accounted for through capital receipts) |
18% (2) |
25% (3) |
67% (10) |
50% (9) |
| The council did not receive EFS in this financial year |
64% (7) |
42% (5) |
13% (2) |
11% (2) |
| EFS was agreed in principle but not utilised by the council in this financial year |
0% (0) |
8% (1) |
0% (0) |
6% (1) |
| Don't know |
0% (0) |
0% (0) |
0% (0) |
0% (0) |
Base: all respondents for each financial year (11 in 2022/23, 12 in 2023/24, 15 in 2024/25, 18 in 2025/26, 56 data points in total).
Table 22: Share of borrowing as opposed to capital receipts by year, excluding not received and don’t know
|
2022/23 |
2023/24 |
2024/25 |
2025/26 |
|
|---|---|---|---|---|
| 0% (none of) capitalisation accounted for through borrowing (all accounted for through capital receipts) |
50% |
33% |
15% |
7% |
| 1-24% of capitalisation accounted for through borrowing |
0% |
0% |
0% |
0% |
| 25-49% of capitalisation accounted for through borrowing |
0% |
0% |
0% |
7% |
| 50-74% of capitalisation accounted for through borrowing |
0% |
0% |
8% |
7% |
| 75-99% of capitalisation accounted for through borrowing |
0% |
17% |
0% |
20% |
| 100% (all of) capitalisation accounted for through borrowing (none accounted for through capital receipts) |
50% |
50% |
77% |
60% |
Base: all respondents who received EFS in each financial year (4 in 2022/23, 6 in 2023/24, 13 in 2024/25, 15 in 2025/26, 38 data points in total).
These results were used to estimate an approximate overall balance of capitalisation through capital receipts as opposed to borrowing across all respondents, using the following process: each capitalisation percentage band was assigned a representative percentage distribution for percentage of capitalisation accounted for through borrowing at the midpoint of its range (0 per cent, 12.5 per cent, 37 per cent, 62 per cent, 87 per cent and 100 per cent respectively), and the percentages of respondents within each band in Table 24 were multiplied by these values to produce an indicative weighted average score for borrowing as a proportion of EFS capitalisations for each financial year. An overall estimate from the percentage balance of borrowing versus capital receipts across the entire period was also computed.
Table 23 shows the results of these calculations, estimating that 50 per cent of EFS capitalisations in 2022/23 were accounted for through borrowing, rising to 65 per cent in 2023/24, 82 per cent in 2024/25, and 84 per cent in 2025/26. Overall across the period, 77 per cent of EFS received was capitalised through borrowing, and 23 per cent through capital receipts.
Table 23: Indicative weighted averages for percentage of EFS capitalisation accounted for through borrowing as opposed to capital receipts across all applicable respondents, by financial year of EFS receipt
|
Per cent |
|
|---|---|
| EFS received between 2022/23 and 2025/26 |
77% |
| EFS received in 2022/23 |
50% |
| EFS received in 2023/24 |
65% |
| EFS received in 2024/25 |
82% |
| EFS received in 2025/26 |
84% |
Based on the 19 respondents who indicated their council had received EFS at least once between 2022/23 and 2025/26. A score of zero per cent would indicate relying entirely on capital receipts for EFS capitalisation, and a score of 100 per cent would indicate relying entirely on borrowing.
Perceived effectiveness of the use of capitalisations in EFS
Respondents who said their council had received EFS at least once between 2022/23 and 2025/26 were asked how effective they thought capitalisations are as a tool for returning councils to financial stability on a timely basis.
Table 24 shows the results for this question, demonstrating that a large majority of respondents who received EFS thought that capitalisations are not effective in promptly returning councils to financial stability: 42 per cent thought that capitalisations are not very effective and 47 per cent thought that they are not at all effective. Eleven per cent thought that they were effective, all of which thought that they were fairly effective as opposed to very effective.
Table 24: Based on your council's experience of the use of capitalisations in EFS, how effective or not do you think capitalisations are as a tool for returning councils to financial stability on a timely basis?
|
Number |
Per cent |
|
|---|---|---|
| Total – effective |
2 |
11% |
| Very effective |
0 |
0% |
| Fairly effective |
2 |
11% |
| Not very effective |
8 |
42% |
| Not at all effective |
9 |
47% |
| Total – not effective |
17 |
89% |
| Don’t know |
0 |
0% |
Base: all respondents who said they had received EFS at least once in the four years from 2022/23 to 2025/26 (19).
Respondents were asked to explain their answer as to the effectiveness of capitalisations in returning councils to financial stability. They were also invited to share any means of supporting their council which they thought would have been more effective. Sixteen respondents provided comments on this topic and their responses fell into the following broad themes:
- That capitalisation defers but does not solve structural problems, in a way that “kicks the can down the road”. Respondents expressed that it was only appropriate for responding to one-off shocks, not for ongoing pressures.
- Relatedly, that pressured leading to the need to apply for EFS were cited by respondents as being long-term and structural in nature, such as homelessness, social care pressures, and costs associated with special educational needs and disabilities (SEND), which cannot be corrected by capitalisation.
- That capitalisation brings new and/or higher debt financing costs through increased interest, reducing service budgets or future investment accordingly.
- That the Fair Funding Review 2.0 has not resolved the major issue of an insufficient amount of sustainable funding.
Proposals respondents made for more effective alternatives to capitalisation included the following:
- An increased amount of ongoing, sustainable funding which better matches the scale of demand for local government services.
- The removal of the council tax referendum limit.
- A greater share of business rates retention for councils.
- Continuing to use capitalisation in specific scenarios where one-off costs are incurred that are not likely to recur regularly, such as redundancy packages and local government reorganisation.
- Policy and system reform to address the underlying causes of issues such as homelessness and demand for SEND services.
Dedicated Schools Grant deficits
This section relates to a series of questions on Dedicated Schools Grant (DSG) deficits included in the survey. It should be noted that since the survey closed on 16 January 2026, these responses were received before the Government’s announcement on 9 February 2026 that 90 per cent of historic DSG deficits would be written off, and were thus provided without knowledge of this measure.
Ability to set a balanced general fund budget in future years
The 87 respondents representing single-tier and county councils were asked a series of questions concerning Dedicated Schools Grant (DSG) deficits. The survey noted that the provisional local government financial settlement indicated that the Government plans to take measures to address councils’ DSG deficits, and asked respondents whether or not, if the statutory override on the treatment of DSG deficits ends as planned in March 2028 without a suitable alternative method for addressing the overspends in DSG-related services, such as special educational needs and disabilities (SEND) provision, their council would be able to set a balanced general fund budget in future years.
Table 25 shows the results for this question, demonstrating that a large majority said that they would not be able to set a balanced budget under these circumstances for all three of the financial years in question (79 per cent for 2028/29, 80 per cent for 2029/30, 79 per cent for 2030/31). A small minority said they would be able to set a balanced budget under these circumstances, but this was lower for later financial years (8 per cent for 2028/29, 5 per cent for 2029/30, 3 per cent for 2030/31). The percentage saying they do not know whether their council could set a balanced budget under the specified conditions rose from 13 per cent for 2028/29 to 15 per cent for 2029/30 and 17 per cent for 2030/31.
Table 25: If the statutory override on the treatment of DSG deficits ends as planned in March 2028 without a suitable alternative method for addressing the overspends in these services, would your council be able, or not, to set a balanced (general fund) budget in future years?
|
2028/29 |
2029/30 |
2030/31 |
|
|---|---|---|---|
| Yes, our council would be able to set a balanced budget |
8% |
5% |
3% |
| No, our council would not be able to set a balanced budget |
79% |
80% |
79% |
| Don’t know |
13% |
15% |
17% |
Base: all single-tier and county council respondents (87).
Councils currently with a DSG deficit
Respondents were asked whether their council had a DSG deficit in 2025/26 at the time of responding to the survey. Table 26 shows the results of this question, demonstrating that almost all (95 per cent) respondents had a DSG deficit in 2025/26, whilst a small minority (5 per cent) said they did not.
Table 26: Does your council currently have a DSG deficit in 2025/26?
|
Total |
|
|---|---|
| Yes |
95% |
| No |
5% |
| Don’t know |
0% |
Base: all single-tier and county council respondents (87).
Impact of unreformed SEND system on future DSG deficits
Respondents with a 2025/26 DSG deficit were asked what would happen to their council’s financial position relating to DSG and SEND in 2028/29, assuming that the Government’s proposals to address their DSG deficit means they no longer have a deficit by 1 April 2028, but the SEND system remains unreformed.
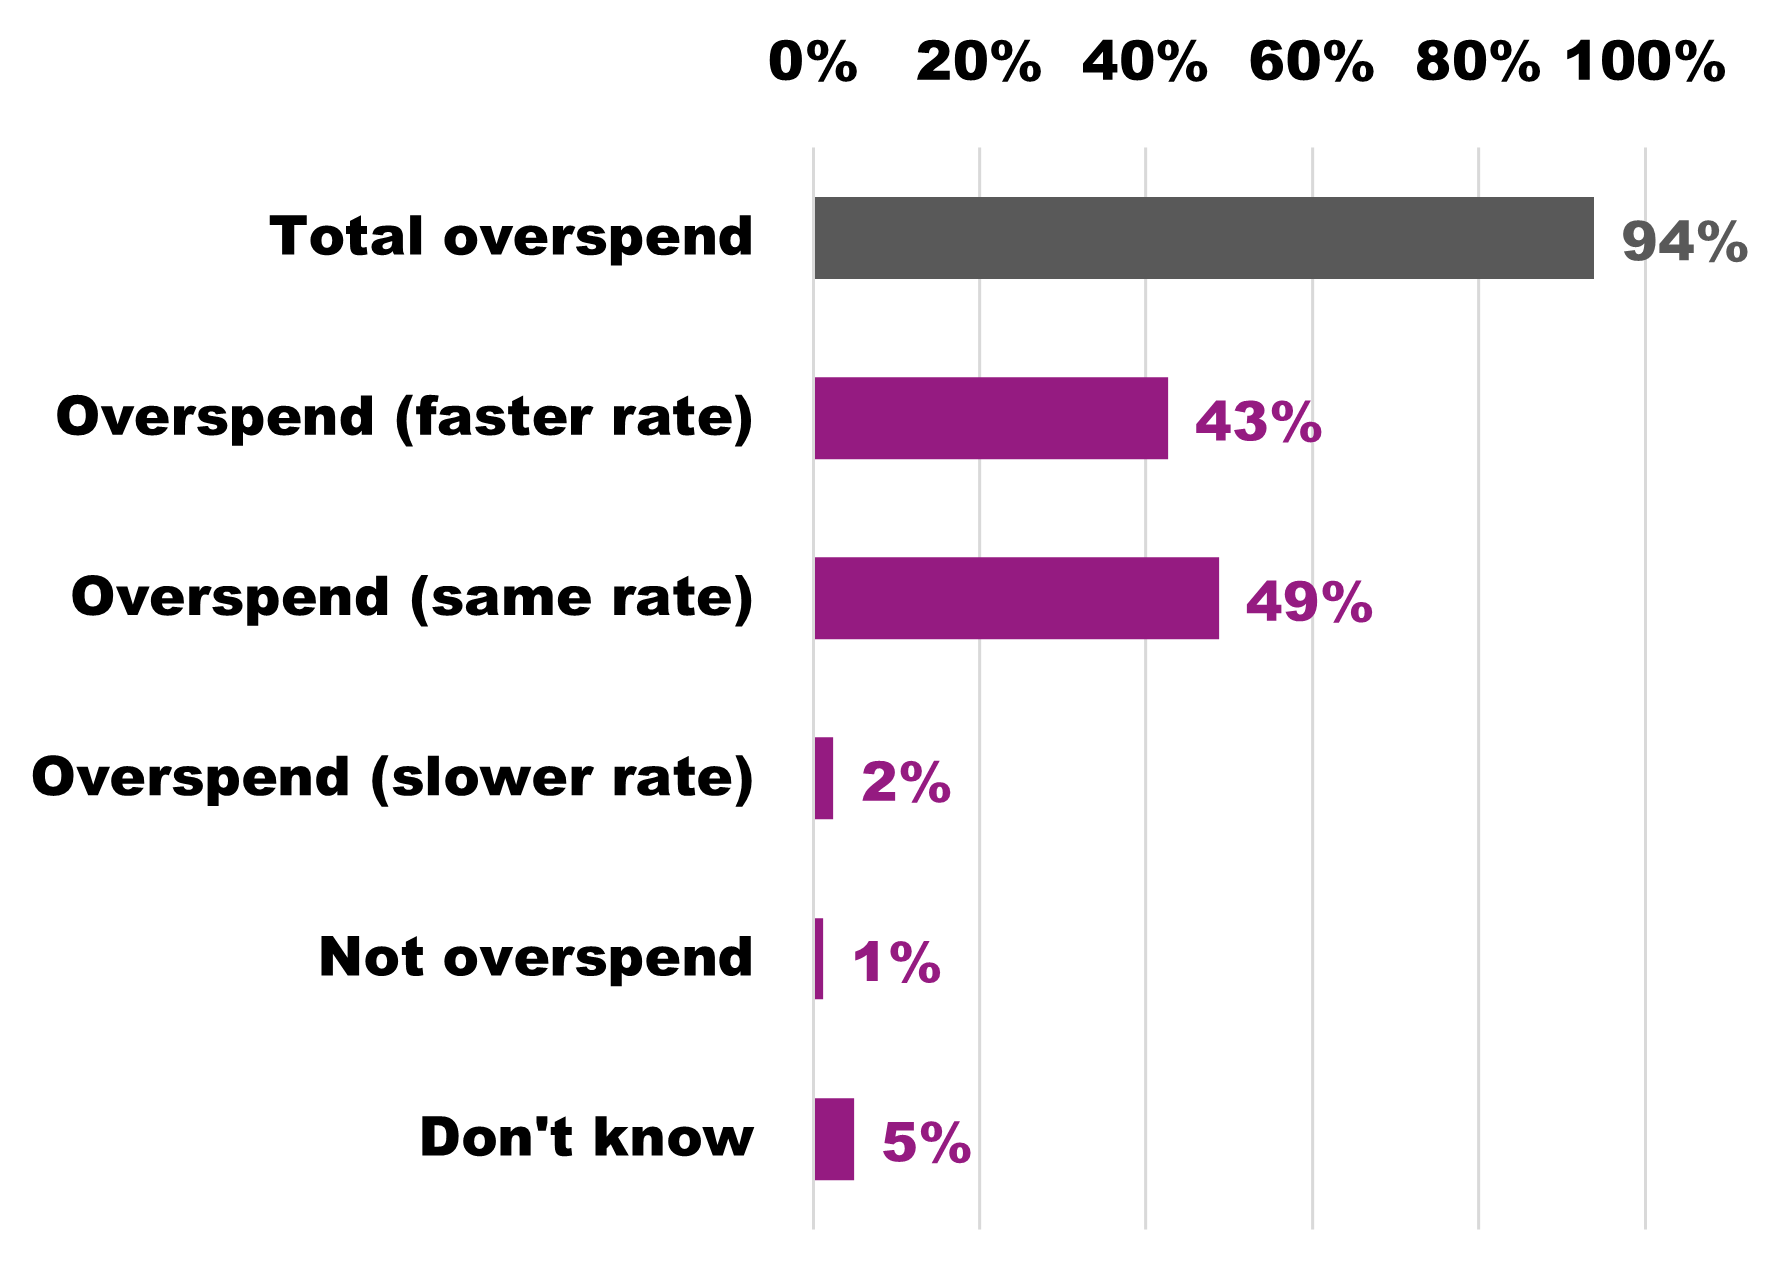
Table 27 shows the results for this question, demonstrating that the vast majority (94 per cent) of respondents with DSG deficits said that if those deficits were removed but the SEND system remained unreformed, they would continue to overspend on their SEND budget in 2028/29. Similar proportions said that they would overspend at a faster rate than before (43 per cent) and at the same rate as before (49 per cent), whilst an additional 2 per cent said they would continue to overspend, but at a slower rate than before. A very small minority (1 per cent) of respondents said they would not overspend their budget in 2028/29 under these circumstances, and 5 per cent did not know what they expenditure in this situation would be.
Table 27: Assuming that the Government's proposals to address your DSG deficit means you no longer have a deficit by 1 April 2028, but that the SEND system remains unreformed, what do you think would happen to your council's DSG SEND financial position in 2028/29?
|
Per cent |
|
|---|---|
| Total – we will overspend our SEND budget |
94% |
| We will overspend our SEND budget at a faster annual rate than before |
43% |
| We will overspend our SEND budget at the same annual rate as before |
49% |
| We will overspend our SEND budget, but at a slower annual rate than before |
2% |
| We will not overspend our SEND budget |
1% |
| Don't know |
5% |
Base: all single-tier and county council respondents with a 2025/26 DSG deficit (82).
Figure 3. DSG financial positions in 2028/29 if deficits are eliminated but the SEND system remains unreformed
Negative impacts of DSG deficits on 2026/27 budget setting
Respondents were asked how much of a negative impact, if any, direct treasury management costs created by DSG deficits will have on their council’s budget setting for 2026/27, which may result from lower levels of interest earned on cash deposits and/or additional borrowing costs to maintain cash levels. Examples of negative impacts included reductions in service expenditure and the need to draw down reserves.
Table 28 shows the results for this question, demonstrating that over three-quarters (77 per cent) said that treasury management costs from DSG deficits would have a significant or moderate negative impact on their 2026/27 budget setting. Of this, over a third (34 per cent) said these costs would have a significant negative impact, and 43 per cent said they would have a moderate negative impact. A further 22 per cent said the costs would have a small negative impact, bringing the total percentage who said there would be some kind of negative impact to 99 per cent. A small minority (1 per cent) said there would be no negative impact from these costs.
Table 28: How much of a negative impact, if any, will direct treasury management costs created by DSG deficits have on your council's budget setting for 2026/27?
|
Per cent |
|
|---|---|
| Total – significant or moderate negative impact |
77% |
| A significant negative impact |
34% |
| A moderate negative impact |
43% |
| A small negative impact |
22% |
| No negative impact |
1% |
| Not applicable - my council is not expected to have a DSG deficit in 2026/27 |
0% |
| Don’t know |
0% |
Base: all single-tier and county council respondents who answered the question (83).
Respondents were asked to provide an explanation for their answer. Forty-two respondents provided textual explanations of the negative impacts on their 2026/27 budgets resulting from DSG deficit-related treasury management costs, of which 28 provided some kind of financial estimate of the scale of the impact. The following summary explores this information and attempts where possible to compare responses to one another. It should be noted that the numerical figures provided and compared here may be less representative of all councils than the structured information shown in the tables of this report, as not all respondents provided each quantity and in many cases the total number mentioning a certain figure was small.
The most frequently quoted figure was the annual DSG deficit servicing cost resulting from reduced income and/or increased expenditure. Twenty-four respondents provided figures for this cost, which ranged from £400,000 to £10.5 million per annum. The mean annual cost among these respondents was £3.2 million per council per annum, although the median, which is a more representative average and not skewed by high outliers, was £2.3 million per council per annum. In most cases these costs were not provided for separate individual years, although one respondent said that their 2026/27 costs would be £2.1 million, an increase of 24 per cent from their 2025/26 level of £1.7 million, and another respondent said their costs would increase by 43 per cent from £4.2 million in 2026/27 to £6 million in 2027/28. A third respondent said that their reduced income was likely to increase by an addition £1 million per year.
Four respondents estimated the size of their year-end DSG deficit as of 31 March 2026. These estimates were £16 million, £60 million, £171 million and £210 million respectively – a mean of £114 million and with a similar median of £116 million, although the small number of estimates means these should only be extrapolated to other councils with caution. One respondent also provided an estimated year-end deficit for 31 March 2027, estimating that the deficit would rise by 50 per cent from £171 million at the end of 2025/26 to £256 million at the end of 2026/27.
Four respondents estimated the total size of their cumulative DSG deficit as of 31 March 2026. These estimates were £8.9 million, £10 million, £40 million and £157 million respectively, at a mean of £54 million and a median of £25 million.
One respondent said that the settlement had worsened their council’s position by around £10.5 million compared to their calculations from the Fair Funding Review 2.0 consultation, “adding to our already difficult position”.
Four respondents estimated the percentage rise in council tax that would be equivalent to their DSG deficit treasury management costs. These estimates were 1 per cent, 1.4 per cent, and in two cases 2 per cent, for a mean of 1.6 per cent. One respondent noted that whilst their council’s deficit funding costs was equivalent to 1.4 per cent of council tax, the cost of actually funding the structural DSG deficit would be equivalent to a 13.5 per cent increase in council tax, and a further 5 per cent increase would be required on top of that to fund the structural deficit for other council services. One respondent also estimated their DSG deficit treasury management costs as a percentage of their net revenue budget, which came to 1.2 per cent.
One respondent noted that half of the exceptional financial support (EFS) they had requested related to their SEND deficit, and would proportionately grow to almost 75 per cent by the third year.
Overall, the comments underscored the severe financial impact of the treasury management costs of servicing DSG deficits, primarily through lost interest income, an increased need for external borrowing, constraints imposed on cash flow, and knock-on effects for the sustainability of councils’ general funds. Respondents noted that cash balances are exhausted, necessitating additional borrowing to meet these costs, and many shared estimates of a substantial increase in these costs over the next few financial years, with the impact of treasury management costs rising in line with the sustained growth of the deficits themselves. Many respondents directly linked rising treasury management costs to pressure to increased council tax, reduced service expenditure and the need to apply for EFS. Some respondents noted an impact on specific service expenditure, especially home-to-school transport and wider children’s services issues, and argued that systemic issues in the SEND system, accompanied by a continuing lack of reform and misalignment between local demand and the current national funding framework, are the key drivers in these deficits and their associated costs rather than local decision-making.
Pay and equal pay
Respondents were asked a series of questions on their budgeted pay awards for 2026/27, their assumptions for future pay awards for subsequent financial years, whether their council is currently facing equal pay claims or expects to in the near future, and its approach to equal pay in terms of budgeting and risk management. This information was collected to inform the LGA’s internal approach to pay-related issues facing councils, but was not intended for publication and hence is not included in this report.
Housing revenue accounts
Whether councils have a HRA
All respondents excluding those representing county councils were asked if their council has a housing revenue account (HRA). Table 29 shows the results for this question, demonstrating that just over half (53 per cent) of single-tier and district councils had a housing revenue account, whilst 47 per cent did not. The remaining questions in this section were shown only to responding councils with HRAs.
Table 29: Does your council have a Housing Revenue Account (HRA)?
|
Per cent |
|
|---|---|
| Yes |
53% |
| No |
47% |
Base: all single-tier and district council respondents (136).
Setting a balanced HRA budget for 2026/27
Respondents were asked how likely it was that their council would need to take a series of actions in order to set a balanced budget for their HRA for the 2026/27 financial year.
Table 30 shows the results for this question. The action which the most respondents said would likely be required was the raising of rents (within allowable limits), identified by 99 per cent of relevant respondents, including 90 per cent who thought it would very likely be needed, and around 8 per cent who thought it was fairly likely to be needed. Next most likely, though it was thought likely by a substantially lower margin of respondents, was reducing the revenue costs of their current HRA capital programme for existing stock, such as by reducing capital expenditure financed by the revenue account (CERA) or delaying or reducing borrowing for existing stock. This was thought likely to be needed by 49 per cent of respondents (22 per cent very likely and 26 per cent fairly likely). This was followed by drawing down on reserves (46 per cent likely, 25 per cent very likely and 21 per cent fairly likely).
More than two-fifths (44 per cent) of applicable respondents thought it likely that they would need to reduce the revenue costs of their current HRA capital programme for new builds. Less frequently thought likely, but still cited by a substantial minority of respondents, were reducing real terms spending on supervision and management (such as managing tenancies, right to buy administration and rent collection, recovery and accounting), at 38 per cent likely, and reducing real terms spending on repairs and maintenance, at 35 per cent likely.
Table 30: In order to set a balanced budget for your HRA for the 2026/27 financial year, how likely is it or not that your council will need to take the following actions?
|
Total – Likely |
Very likely |
Fairly likely |
Not very likely |
Not at all likely |
Don’t know |
|
|---|---|---|---|---|---|---|
| Raising rents |
99% |
90% |
8% |
1% |
0% |
0% |
| Reducing the revenue costs of your current HRA capital programme for existing stock |
49% |
22% |
26% |
26% |
24% |
1% |
| Drawing down on reserves |
46% |
25% |
21% |
30% |
23% |
1% |
| Reducing the revenue costs of your current HRA capital programme for new builds |
44% |
22% |
22% |
35% |
17% |
4% |
| Reducing real terms spending on supervision and management |
38% |
15% |
22% |
39% |
22% |
1% |
| Reducing real terms spending on repairs and maintenance |
35% |
10% |
25% |
35% |
29% |
1% |
Base: all responding councils with HRAs (72).
Confidence in HRA sustainability
Respondents were asked how confident or not they were that over the next five financial years their council’s HRA would be able to do a series of actions. They were asked this under two sets of circumstances:
- Under the Government’s 10-year social housing rent settlement of the consumer price index (CPI) plus 1 per cent, but without the introduction of rent convergence
- If the Government were also to introduce rent convergence at £2 per week from the 2026/27 financial year onwards.
It should be noted that the survey was conducted before the Government’s announcement on 28 January that rent convergence will be introduced starting at £1 per week from 2027/28 and rising to £2 per week from 2028/29, representing an intermediate scenario between the two the respondents were presented with. As such, whilst in the survey the first scenario was at that time the actual circumstances facing the respondents and the second a hypothetical one, given the Government’s subsequent announcement, the current confidence of councils may be closer to the second scenario than the first one, although the actual announcement did not introduce rent convergence to the same extent as the second scenario and as such, actual levels of confidence are unlikely to be as high as under that scenario.
Table 31 shows the results for this question under the first scenario, if no rent convergence were introduced. This shows that 71 per cent of respondents would have been confident that their HRA could balance its annual budget over the following five financial years, whilst 25 per cent would not have been confident with this. A similar distribution of confidence would have existed for maintaining supervision and management services to the necessary level through revenue expenditure, whilst lower levels of confidence would have existed for maintaining HRA reserves at a prudent level (69 per cent confident, 26 per cent not confident), investing in existing stock through the capital programme to ensure it meets necessary standards (58 per cent confident, 38 per cent not confident), and investing in planned new build programmes (43 per cent confident, 51 per cent not confident). Only 1 per cent would have been very confident of investing in their new build programmes as planned under a scenario with no rent convergence.
Table 31: Thinking about the next five financial years, how confident, or not, are you that during this period your council's HRA would be able to do the following? (if no rent convergence)
|
Total – Confident |
Very confident |
Fairly confident |
Not very confident |
Not at all confident |
Don’t know |
|
|---|---|---|---|---|---|---|
| Balance the HRA budget annually |
71% |
17% |
54% |
22% |
3% |
4% |
| Maintain supervision and managements services to the necessary level (revenue spend) |
71% |
3% |
68% |
25% |
0% |
4% |
| Maintain HRA reserves at a prudent level |
69% |
11% |
58% |
15% |
11% |
4% |
| Repair and maintain existing stock to the necessary standards (revenue spend) |
61% |
3% |
58% |
29% |
4% |
6% |
| Invest in existing stock to ensure it meets necessary standards (capital programme) |
58% |
3% |
56% |
33% |
4% |
4% |
| Invest in planned new build programmes (capital programmes) |
43% |
1% |
42% |
36% |
15% |
6% |
Base: all responding councils with HRAs (72).
Table 32 shows levels of confidence for the same activities if rent convergence of £2 per week had been introduced from 2026/27. The actions remained in the same order but confidence in them rose, ranging from 80 per cent for balancing the HRA budget to 59 per cent for investing in planned new build programmes. Lack of confidence ranged from 7 per cent for the former to 26 per cent for the latter.
Table 32: Thinking about the next five financial years, how confident, or not, are you that during this period your council's HRA would be able to do the following? (if rent convergence of £2 per week from 2026/27)
|
Total – Confident |
Very confident |
Fairly confident |
Not very confident |
Not at all confident |
Don’t know |
|
|---|---|---|---|---|---|---|
| Balance the HRA budget annually |
80% |
24% |
56% |
7% |
0% |
13% |
| Maintain supervision and managements services to the necessary level |
77% |
17% |
60% |
10% |
0% |
13% |
| Maintain HRA reserves at a prudent level |
74% |
21% |
53% |
11% |
1% |
13% |
| Repair and maintain existing stock to the necessary standards |
73% |
14% |
59% |
14% |
0% |
13% |
| Invest in existing stock to ensure it meets necessary standards |
73% |
16% |
57% |
14% |
0% |
13% |
| Invest in planned new build programmes |
59% |
11% |
47% |
24% |
1% |
16% |
Base: all responding councils with HRAs (72).
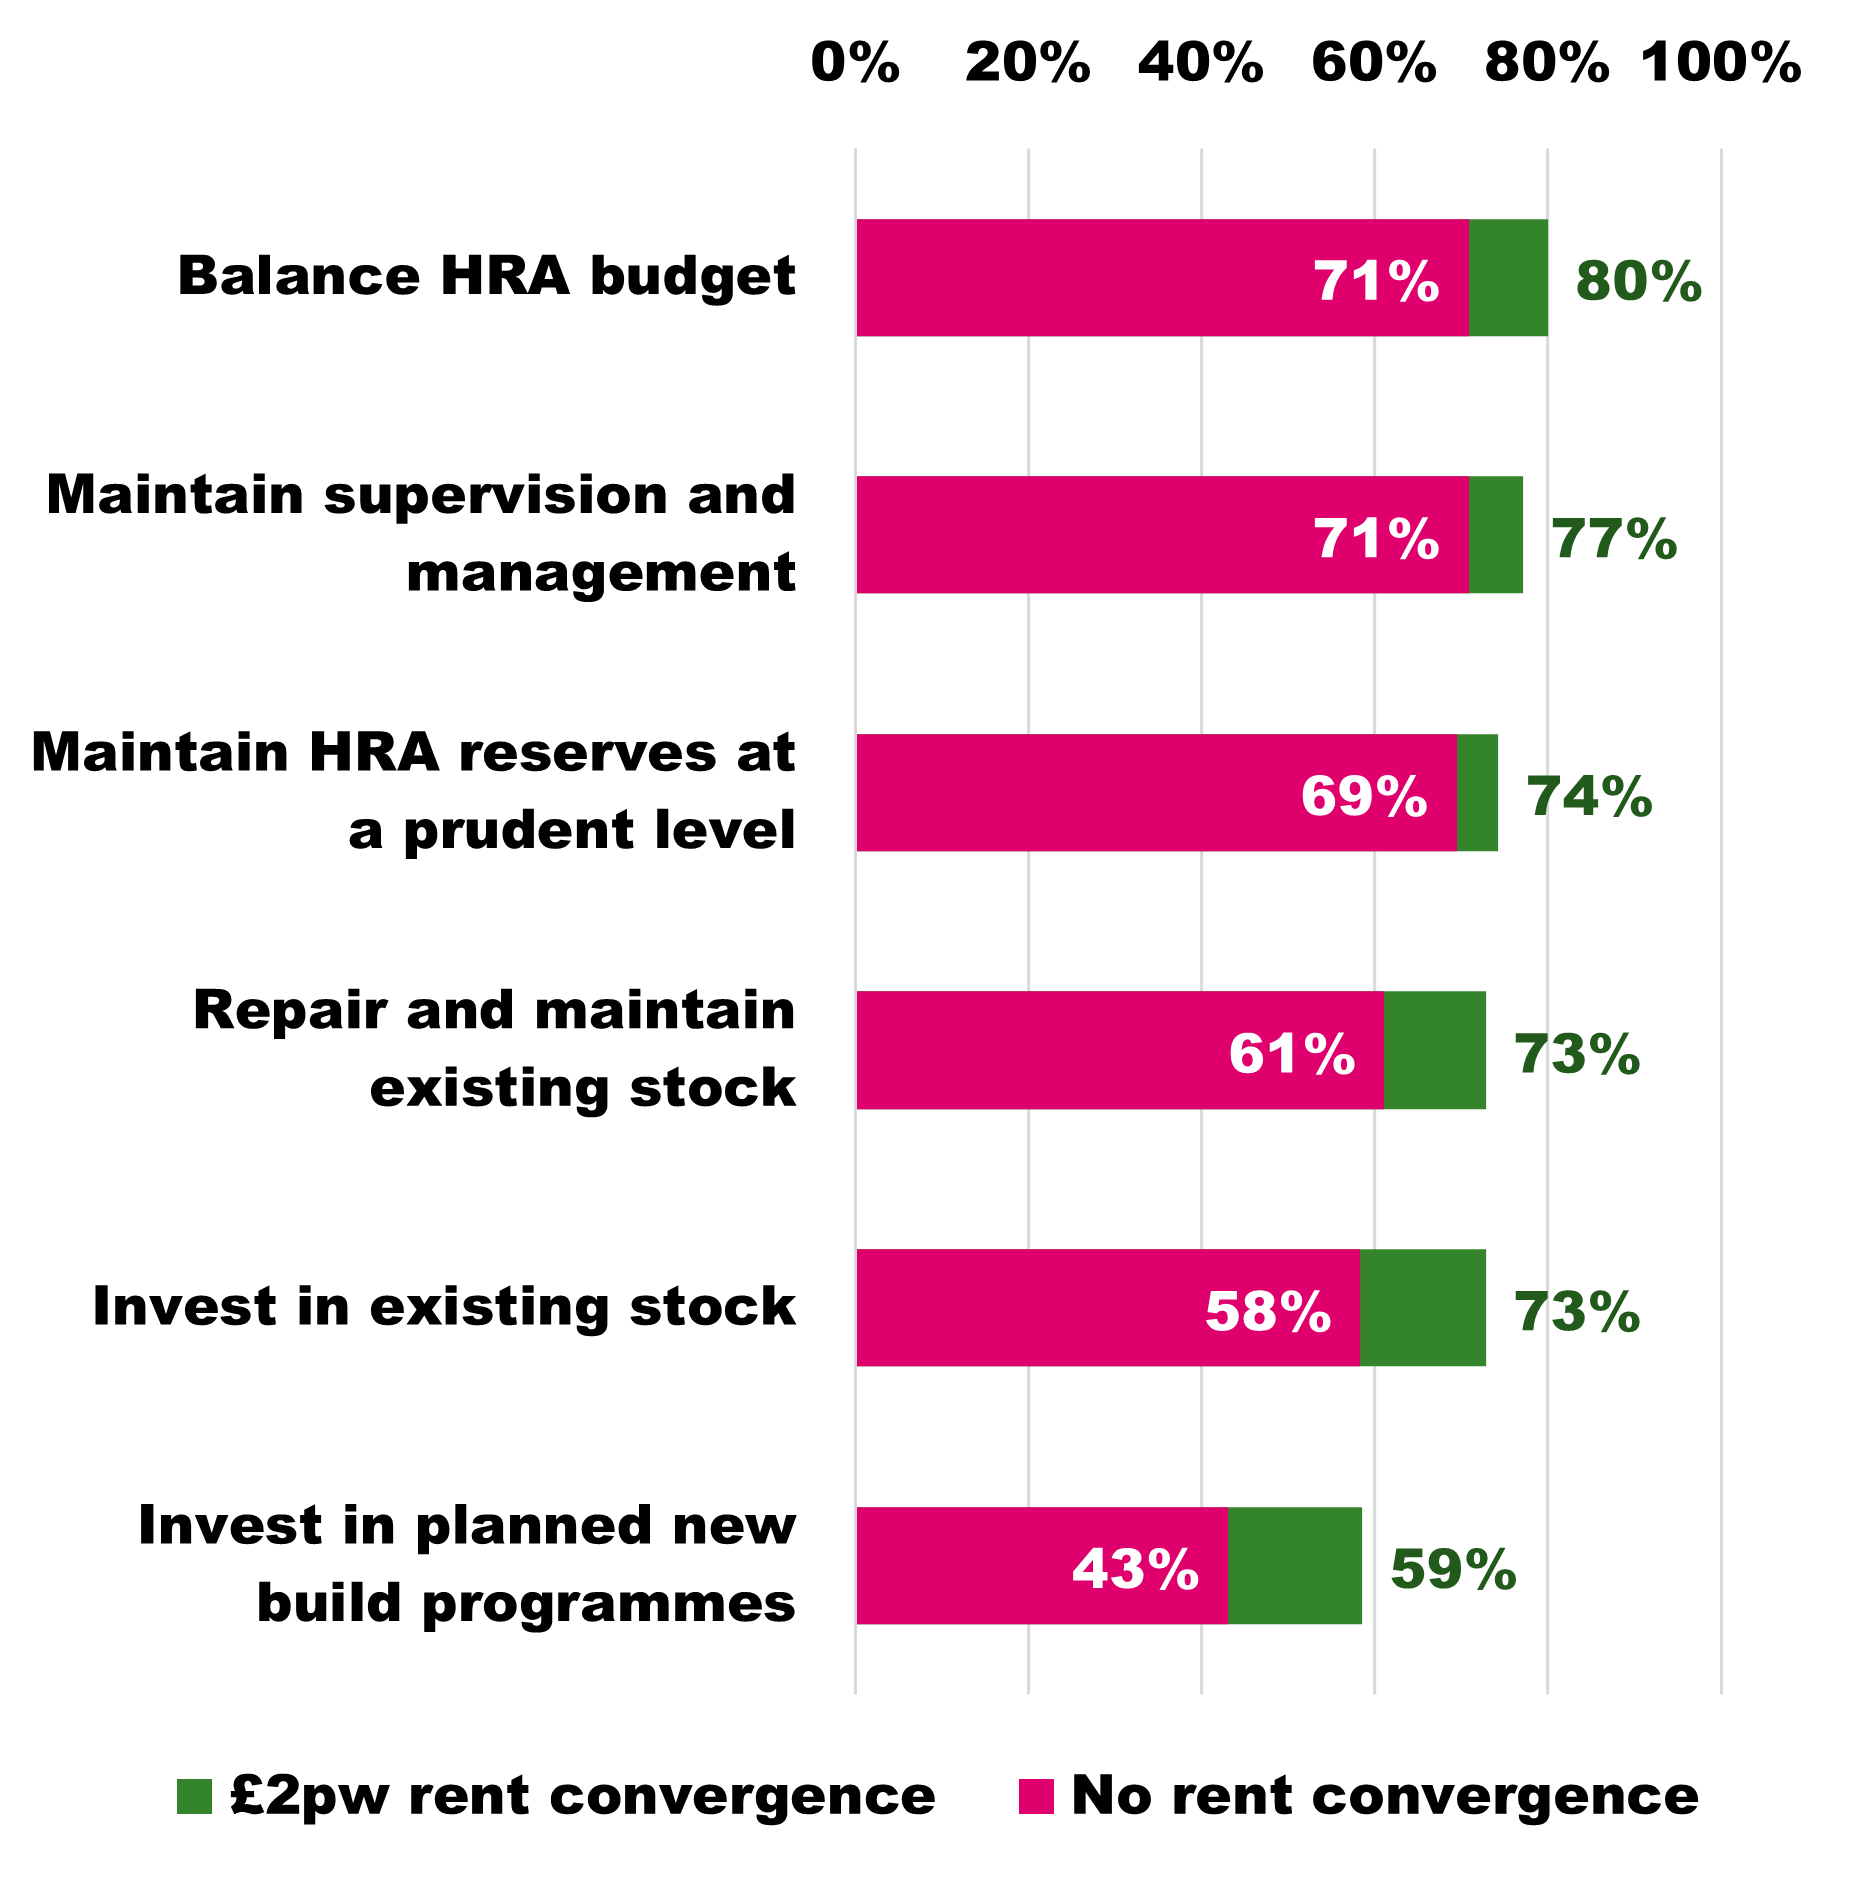
Table 33 and Figure 4 show confidence levels under both scenarios for each action side-by-side, along with the percentage difference resulting from 2 per cent rent convergence from 2026/27, if this had been introduced. This shows that confidence levels would have been higher for each action under this scenario in contrast to a scenario of no rent convergence, varying from a 5 percentage point increase in confidence for maintaining HRA reserves at a prudent level, to a 16 percentage point increase for investing in planned new build programmes.
Table 33: Comparison of confidence levels by scenario
|
No rent convergence |
2% rent convergence from 2026/27 |
Increase from 2% rent convergence |
|
|---|---|---|---|
| Balance the HRA budget annually |
71% |
80% |
9% |
| Maintain supervision and managements services to the necessary level |
71% |
77% |
6% |
| Maintain HRA reserves at a prudent level |
69% |
74% |
5% |
| Repair and maintain existing stock to the necessary standards |
61% |
73% |
12% |
| Invest in existing stock to ensure it meets necessary standards |
58% |
73% |
15% |
| Invest in planned new build programmes |
43% |
59% |
16% |
Base: all responding councils with HRAs (72).
Figure 4. Confidence in ability to perform HRA actions with and without £2 per week rent convergence
Change in revenue funding provided
Respondents were asked how much support their council would provide in revenue funding in 2026/27 to small businesses and to residents who need additional support to access national employment programmes following the introduction of the new funding arrangements, compared to the funding they provided from the UKSPF.
Table 35 shows the results for this question, excluding those who said they did not know, which again comprised a significant proportion of respondents (40 per cent for small businesses, 41 per cent for residents needing additional support). This shows that a small minority of respondents (3 per cent for small businesses, 5 per cent for residents) anticipated providing more revenue funding in this area than previously under the UKSPF, most of whom were anticipating providing slightly more support rather than significantly more support. Around a third (33 per cent for small businesses, 35 per cent for residents) anticipated providing the same level of revenue funding support as before, whilst a majority (65 per cent for small businesses, 60 per cent for residents) anticipated providing less support than under the UKSPF, the largest proportion of which anticipated providing significantly rather than slightly less support, whilst a significant minority (13 per cent for small businesses, 17 per cent for residents) anticipated providing no support in future.
Table 35: Compared to the UKSPF, how much support, if any, will your council provide in revenue funding in 2026/27 to the following groups following the introduction of the new funding arrangements? Excluding ‘don’t know’
|
Small businesses |
Residents who need additional support to access national employment programmes |
|
| Total – more support |
3% |
5% |
| Significantly more support |
1% |
0% |
| Slightly more support |
1% |
5% |
| The same level of support as before |
33% |
35% |
| Slightly less support |
25% |
17% |
| Significantly less support |
28% |
27% |
| No support |
13% |
17% |
| Total – less or no support |
65% |
60% |
Base: all single-tier and district council respondents who answered the question and did not say ‘don’t know’. (80 for small businesses, 78 for residents needing support).
Final comments
All respondents were asked if they had any further comments on the topics covered by the survey. Twenty-three respondents provided further comments, which fell into the following broad themes:
- Dissatisfaction with how funding is allocated under the Fair Funding Review 2.0, with some councils feeling like ‘significant losers’ and anticipating a ‘financial cliff-edge’ in 2029/30.
- Assertions that current council tax referendum principles entrench inequality and benefit authorities with historically higher tax rates.
- A perception that the contributions made by district councils are both undervalued and underfunded.
- Fears that a major redistribution is ‘unprecedented’ and destabilising.
- Highlighting cost pressures on a number of core statutory service areas, including:
- adult social care
- children’s social care
- home-to-school transport, and
- homelessness services.
- A warning against a proposal to ‘write off SEND deficits’ without reforming the system and improving DSG funding on an ongoing basis.
- A worry that the FFR 2.0 funding formulas lack transparency and are less linked to evidence of need, particularly the removal of remoteness factors.
- A call for sustainable, long-term funding solutions, rather than year-by-year adjustments.
Annex A: Questionnaire
Council characteristics
1. What is your council type?
- County
- District
- London borough
- Metropolitan district
- Unitary
2. In which region is your council?
- East of England
- East Midlands
- London
- North East
- North West
- South East
- South West
- West Midlands
- Yorkshire and the Humber
3. If your council is involved in upcoming local government reorganisation (LGR), in which financial year do you expect the vesting for the new authority to take place?
- 2027/28
- 2028/29
- 2029/30 or later
- n/a – my council is not currently expecting to be involved in LGR
- Don’t know
Financial overview
4. Following the Provisional Local Government Financial Settlement (PLGFS) and Autumn Budget, compared to previous years, how difficult or not will it be for your council to set a balanced budget for the 2026/27 financial year?
- Very difficult
- Fairly difficult
- Not very difficult
- Not at all difficult
- Don’t know
5. How confident or not are you that your council will have sufficient funding to fulfil all your statutory duties in each of the three financial years from 2026/27 to 2028/29? If your council will be reorganised in this period, please answer the question as if your current council was going to continue to exist in its current form over this period.
Columns:
- Very confident
- Fairly confident
- Not very confident
Not at all confident
- Don’t know
Rows:
- 2026/27
- 2027/28
- 2028/29
The Fair Funding Review and the provisional LGFS
6. The provisional settlement includes the impact of the Fair Funding Review 2.0 (including the retained business rates reset), which has reallocated funding between councils. Compared to the allocation of funding used for 2025/26, do you think the reallocation of funding via the Fair Funding Review 2.0 will make your council's finances stronger or weaker over the period 2026/27 to 2028/29?
- Significantly stronger
- Somewhat stronger
- About the same
- Somewhat weaker
- Significantly weaker
- Don't know
7. Following the outcome of the Fair Funding Review 2.0, how confident or not are you that your council can meet expected cost and demand pressures as set out in your medium-term financial plan over the three years of the Spending Review period (from 2026/27 to 2028/29)? If your council will be reorganised in this period, please answer the question as if your current council was going to continue to exist in its current form over this period.
- Very confident
- Fairly confident
- Not very confident
- Not at all confident
- Don't know
Exceptional financial support (EFS)
8. Has your council already, or is it likely to, submit an application for retrospective EFS to support in-year pressures for the 2025/26 financial year? This refers to any application submitted on or after 1 April 2025 to support cost pressures over the 2025/26 financial year.
- Have already applied
- Very likely to apply
- Fairly likely to apply
- Not very likely to apply
- Not at all likely to apply
- Don't know
9a. How likely or not is it that your council will apply for exceptional financial support (EFS) to support its budget in future years? If your council will be reorganised in this period, please answer the question as if your current council was going to continue to exist in its current form over this period.
Columns:
- Have already applied
- Very likely to apply
- Fairly likely to apply
- Not very likely to apply
- Not at all likely to apply
- Don't know
Rows:
- To support the council's 2026/27 budget
- To support the council's 2027/28 budget
- To support the council's 2028/29 budget
9b. If your council does apply for EFS in 2026/27, or has already done so, which elements is it likely to apply for? Please select all that apply.
10. How, if at all, has the reallocation of funding via the Fair Funding Review 2.0 affected the likelihood of your council needing to apply for EFS to set its future budgets? If your council will be reorganised in this period, please answer the question as if your current council was going to continue to exist in its current form over this period. Following the reallocation of funding in the Fair Funding Review 2.0, the likelihood of your council applying for EFS is now:
Columns:
- Much more likely
- More likely
- No change
- Less likely
- Much less likely
- Don't know
Rows:
- 2026/27 budget
- 2027/28 budget
- 2028/29 budget
11. Has your council received EFS at any point in the four years from 2022/23 to 2025/26?
- Yes
- No
- Don’t know
12. In terms of how you used your capitalised costs from EFS in previous years, what share was borrowing, as opposed to the use of capital receipts?
Columns:
- EFS received in 2022/23
- EFS received in 2023/24
- EFS received in 2024/25
- EFS received in 2025/26
Rows:
- 0% (none of) capitalisation accounted for through borrowing (all accounted for through capital receipts)
- 1-24% of capitalisation accounted for through borrowing
- 25-49% of capitalisation accounted for through borrowing
- 50-74% of capitalisation accounted for through borrowing
- 75-99% of capitalisation accounted for through borrowing
- 100% (all of) capitalisation accounted for through borrowing (none accounted for through capital receipts)
- The council did not receive EFS in this financial year
- EFS was agreed in principle but not utilised by the council in this financial year
- Don't know
13a. Based on your council's experience of the use of capitalisations in EFS, how effective or not do you think capitalisations are as a tool for returning councils to financial stability on a timely basis?
- Very effective
- Fairly effective
- Not very effective
- Not at all effective
- Don't know
13b. Please provide an explanation for your answer. We are also keen to hear whether or not you think there would have been more effective means of supporting your council.
DSG deficits
14. The provisional local government financial settlement indicated that the Government plans to take measures to address councils' Dedicated Schools Grant (DSG) deficits. However, if the statutory override on the treatment of DSG deficits ends as planned in March 2028 without a suitable alternative method for addressing the overspends in these services, would your council be able, or not, to set a balanced (general fund) budget in future years? If your council will be reorganised in this period, please answer the question as if your current council was going to continue to exist in its current form over this period.
Columns:
- Yes
- No
- Don’t know
Rows:
- Our council could set a balanced budget in 2028/29
- Our council could set a balanced budget in 2029/30
- Our council could set a balanced budget in 2030/31
15a. The provisional local government finance settlement indicated that Government will take forward a plan to address councils' DSG deficits. However, ahead of the Government's delayed Schools White Paper, the plan for long-term reform to SEND provision is not clear. Does your council currently have a DSG deficit in 2025/26?
- Yes
- No
- Don’t know
15b. Assuming that the Government's proposals to address your DSG deficit means you no longer have a deficit by 1 April 2028, but that the SEND system remains unreformed, what do you think would happen to your council's DSG SEND financial position in 2028/29?
- We will overspend our SEND budget at a faster annual rate than before
- We will overspend our SEND budget at the same rate as before
- We will overspend our SEND budget, but at a slower rate than before
- We will not overspend our SEND budget
- Don't know
16a. DSG deficits create a direct treasury management cost to councils through lower levels of interest earned on cash deposits, and/or additional borrowing costs to maintain cash levels. How much of a negative impact, if any, will these costs have on your council's budget setting for 2026/27, for instance, through reductions in service expenditure or the need to draw down reserves?
- A significant negative impact
- A moderate negative impact
- A small negative impact
- No negative impact
- Not applicable - my council is not expected to have a DSG deficit in 2026/27
- Don't know
16b. Please provide an explanation for your answer.
Pay and equal pay
17. What percentage figure has your council budgeted for a pay award in 2026/27? Please provide a simple number, with decimal places if required but no letters or percentage symbols (for example, '2.75' rather than '2.75%', '2.75 per cent' or '0.0275'). If your council has not budgeted for any increase, please provide a value of zero. If you are unable to answer this question, please leave the box blank.
18. What budget assumptions, if any, has your council made for subsequent pay awards in the three financial years following 2026/27? Please provide simple numbers, with decimal places if required but no letters or percentage symbols. If your council will be reorganised in this period, please answer the question as if your current council was going to continue to exist in its current form over this period.
Rows:
- Assumed budget increase for future pay awards
- No assumption made as yet
- Don’t know
19. Is your council currently facing any equal pay claims?
- Yes
- No
- Don’t know
20. Excluding any live claims, does your council expect to have any equal pay claims within the next three financial years?
- Yes
- No
- Don’t know
21a. Does your council currently identify equal pay specifically as a risk on its corporate/institutional risk register?
- Yes - identified as high risk or equivalent
- Yes - identified as medium risk or equivalent
- Yes - identified as low risk or equivalent
- No - not currently, but the council plans to introduce it
- No - and no current plans to introduce it
- Don’t know
21b. Has your council made a budgetary provision for this corporate risk?
- Yes
- No
- Don’t know
Housing revenue accounts
22. Does your council have a Housing Revenue Account (HRA)?
- Yes
- No
23. In order to set a balanced budget for your HRA for the 2026/27 financial year, how likely is it or not that your council will need to take the following actions?
Columns:
- Very likely
- Fairly likely
- Not very likely
- Not at all likely
- Don’t know
Rows:
- Drawing down on reserves
- Reducing the revenue costs of your current HRA capital programme for existing stock (e.g. by reducing capital expenditure financed by the revenue account (CERA) or delaying/reducing borrowing)
- Reducing the revenue costs of your current HRA capital programme for new builds (e.g. by reducing capital expenditure financed by the revenue account (CERA) or delaying/reducing borrowing)
- Reducing real terms spending on repairs and maintenance
- Reducing real terms spending on supervision and management (such as managing tenancies, right to buy administration and rent collection, recovery and accounting)
- Raising rents (within allowable limits)
24. From the 2026/27 financial year, the Government is bringing in a 10-year social housing rent settlement of the consumer price index (CPI) plus 1 per cent. Thinking about the next five financial years, how confident, or not, are you that during this period your council's HRA would be able to do the following? If your council will be reorganised in this period, please answer the question as if your current council was going to continue to exist in its current form over this period.
Columns:
- Very confident
- Fairly confident
- Not very confident
- Not at all confident
- Don’t know
Rows:
- Balance the HRA budget annually
- Maintain HRA reserves at a prudent level
- Repair and maintain existing stock to the necessary standards (revenue spend)
- Maintain supervision and managements services to the necessary level (revenue spend)
- Invest in existing stock to ensure it meets necessary standards (capital programme)
- Invest in planned new build programmes (capital programmes)
25. If the Government were to introduce rent convergence at £2 per week from the 2026/27 financial year onwards, alongside the 10-year rent settlement, how confident or not would you be that over the next five years your council would be able to do the following? If your council will be reorganised in this period, please answer the question as if your current council was going to continue to exist in its current form over this period.
Columns:
- Very confident
- Fairly confident
- Not very confident
- Not at all confident
- Don’t know
Rows:
- Balance the HRA budget annually
- Maintain HRA reserves at a prudent level
- Repair and maintain existing stock to the necessary standards (revenue spend)
- Maintain supervision and managements services to the necessary level (revenue spend)
- Invest in existing stock to ensure it meets necessary standards (capital programme)
Final comments
28. If you have any other comments on the topics covered by this survey, please provide them below.