
Summary
Background
In August to September 2025, the Local Government Association (LGA) Planning Advisory Service (PAS) sent an online survey to heads of planning or equivalent at local planning authorities (LPAs) in England. The purpose of the survey was to gather intelligence on the extent to which the fees for planning applications set out in the national fee schedule reflect the full costs of processing and deciding those applications, to identify where the biggest cost recovery challenges lie, and to gather LPAs’ views on the potential for some councils setting their own localised fees in future. A total of 147 responded – a response rate of 45 per cent.
Key findings
- The planning application types in the current national planning fee schedule which respondents identified as representing the biggest challenge to cost recovery were the following:
- Removal or variation of a condition following grant of planning permission (major) - 92 per cent considered the current schedule fee underpriced, that the schedule fee represented approximately 57 per cent of costs incurred), and with 39 per cent of respondents considering it one of their top three application types that should be prioritised for a review of the fee.
- Discharge of condition(s) - 92 per cent considered this underpriced, that the schedule fee represented 62 per cent of costs incurred, and 35 per cent prioritising these for review.
- Outline applications (especially major) - 88 per cent considered this underpriced, that the schedule fee represented 64 per cent of costs incurred, and 32 per cent prioritising these for review).
- Removal or variation of a condition following grant of planning permission (non-major) - 88 per cent considered these underpriced, that the schedule fee represents as 64 per cent of costs incurred, and 11 per cent prioritising these for review).
- Householder applications were considered underpriced to a lesser degree than other application types: however, they were the fourth most highly prioritised for fee review (23 per cent), likely due to the large volume of applications received.
- Just over a third of respondents (34 per cent) had entered into charged-for planning performing agreements (PPAs) with developers or project promoters for Nationally Significant Infrastructure Projects (NSIPs).
- An estimated 64 per cent of the costs incurred in planning performance agreements (PPAs) for NSIPs are recovered by councils.
- Just under a third (29 per cent) said that their council would set its own localised planning application fees, if legislation allowed it, whilst 58 per cent said they may or may not do this.
Introduction
In August to September 2025, the Local Government Association (LGA) Planning Advisory Service (PAS) distributed a consultation survey to heads of planning or equivalent at English local planning authorities (LPAs). The purpose of the survey was to gather intelligence on the extent to which the fees for planning applications set out in the national fee schedule reflect the full costs of processing and deciding those applications, to identify where the biggest cost recovery challenges lie, and to gather the LPAs’ views on the potential for some councils setting their own localised fees in future. The survey also included a suite of questions on Nationally Significant Infrastructure Projects (NSIPs), and the extent to which LPAs were able to recover their costs through the setting of fees.
Methodology
On 7 August 2025, the LGA’s Research and Information team distributed an online survey, co-designed in partnership with the Planning Advisory Service (PAS), to heads of planning or equivalent roles at all English Local Planning Authorities (LPAs). One response to the survey was sought from each applicable council, and delegation of the response to the officer(s) in the best position to provide the requested information was encouraged. The survey was in the field for approximately six weeks and was closed on 19 September.
Of the 327 LPAs invited to respond to the consultation survey, a total of 147 submitted a response – a response rate of 45 per cent. Whilst these respondents may not be fully representative of all English LPAs, this level of response provide a good indication of the position of the sector more widely.
Table 1 and Table 2 show the level of response for each council type and region (note that National Park authorities are not included in the latter table, as they in some cases cut across regional boundaries). This shows that a reasonably consistent level of response was received from all councils, regardless of type or region. The council type response rates ranged from 41 per cent, for unitary authorities, to 52 per cent, for London boroughs, whilst the regional response rates ranged from 33 per cent, for the North East, to 55 per cent, for the South West.
Table 1: Response rate by type of council
| Type of council |
Number of questionnaires |
Number of responses |
Response rate |
|---|---|---|---|
| District |
164 |
73 |
45% |
| County |
21 |
9 |
43% |
| London borough |
33 |
17 |
52% |
| Metropolitan district |
36 |
17 |
47% |
| Unitary |
63 |
26 |
41% |
| National park |
10 |
5 |
50% |
Table 2: Response rate by region
| Region |
Number of questionnaires |
Number of responses |
Response rate |
|---|---|---|---|
| Eastern |
50 |
19 |
38% |
| East Midlands |
39 |
17 |
44% |
| London |
33 |
17 |
52% |
| North East |
12 |
4 |
33% |
| North West |
36 |
16 |
44% |
| South East |
70 |
29 |
41% |
| South West |
29 |
16 |
55% |
| West Midlands |
33 |
16 |
48% |
| Yorkshire and Humber |
15 |
8 |
53% |
In addition, the following should be considered when interpreting the findings of this survey:
- Where tables and figures report the ‘base’, the description refers to the group of people who were asked the question, and from which percentages have been calculated. Please note that bases can vary throughout the survey.
- Numbers and percentages are provided for any questions where the base was less than 50. To calculate the number of respondents who provided a certain response for other questions, simply multiply the percentage provided by the base.
- Throughout the report, percentages may not appear to add up to exactly 100 per cent due to rounding.
- All national fee schedule fees quoted are based on the fee at the time that the survey was live (August – September 2025).
Planning application costs and fees – survey of councils
This section analyses the full results of the survey.
Fees compared to costs by application type
Respondents were presented with a summarised list of planning application types set out in the current national fee schedule, updated as of April 2025, and were asked how the fee set out in the schedule compared with the typical costs incurred in processing and deciding applications of that type. In considering this, they were asked to consider the full costs, including the salary and on-costs of all staff involved, the cost of specialist input and fees paid to consultees, IT and equipment, premises and any other significant costs and overheads incurred. Where respondents did not have access to precise information at the time of responding to the survey, and were asked to provide estimations based on their or their teams’ experience, professional judgement, and evidence available to them.
For each application type, respondents were given the following options:
- The national fee is overpriced - it exceeds the typical cost incurred.
- The national fee is about right - it reflects the typical cost incurred.
- The national fee is moderately underpriced - it covers between 75-99 per cent of the typical cost incurred.
- The national fee is significantly underpriced - it covers between 50-74 per cent of the typical cost incurred.
- The national fee is seriously underpriced - it covers less than 50 per cent of the typical cost incurred.
- Don't know.
The full results from this question are displayed in Appendix A. As a significant amount of information was generated, abbreviated summaries are displayed in the main body of this report below.
Application types most often considered underpriced
Table 3 shows each planning application type that 80 per cent or more of respondents said was either moderately, significantly or seriously underpriced in the current fee schedule (excluding respondents who answered ‘don’t know’ for each application type). This shows that:
- 17 of the 39 application types in the fee schedule were deemed underpriced relative to the costs incurred in processing and deciding these applications
- discharge of condition(s) and removal or variation of a condition following grant of planning permission (major), were the most frequently marked as underpriced; both thought to be underpriced by 92 per cent of respondents.
- A further 14 application types were thought to be underpriced by between 70 and 79 per cent of respondents
- householder applications (64 per cent), enlargement or alternations to existing dwellings (65 per cent), and erections, alterations or replacement of plant and machinery (65 per cent) were among the remaining eight application types considered underpriced the least often.
Application types considered ‘seriously’ underpriced
Application types were considered as being seriously underpriced (with the current schedule fee covering less than half of typical costs) by between 7 and 52 per cent of respondents, with the application types most frequently considered seriously underpriced include operations drilling for oil or natural gas (not more than 7.5 hectares), at 52 per cent, and removal or variation of a condition following grant of planning permission (major), at 51 per cent.
Table 3: Schedule fees most frequently identified as being underpriced
| Application type |
Percentage |
|---|---|
| Discharge of condition(s) |
92% |
| Removal or variation of a condition following grant of planning permission (major) |
92% |
| Outline applications (non-major) |
88% |
| Outline applications (major) |
88% |
| Removal or variation of a condition following grant of planning permission (non-major) |
88% |
| Prior approval (upward extensions, new dwelling houses, 10-50 units) |
87% |
| Erection of dwellings (non-major - fewer than 10 units) |
87% |
| Prior approval (upward extensions, new dwelling houses, <10 units) |
86% |
| Other change of use of a building or land |
85% |
| Waste (not more than 15 hectares) |
85% |
| Prior approval (upward extensions to create new dwelling houses - more than 50 units) |
85% |
| Reserved matters following a grant of outline planning permission |
85% |
| Change of use of building to use as dwellinghouse (10-50 units) |
84% |
| Prior approval (under the permitted development rights listed) |
83% |
| Other operations for the winning and working of minerals (not more than 15 hectares) |
82% |
| Change of use of building to use as dwellinghouse (more than 50 units) |
82% |
| Erection of dwellings (medium/major - 10-50 units) |
82% |
Application types least often considered underpriced
The application types least often considered seriously underpriced included:
- enlargement or alterations to existing dwellings (7 per cent),
- householder applications (11 per cent), and
- non-major outline applications (13 per cent).
There was a general correlation between the total proportion of respondents describing an application type as overpriced and the proportion describing it as seriously underpriced. Some, however, like both of the application types involving the change of use of a building to use as a dwelling-house, were considered generally underpriced by a large proportion of respondents but seriously underpriced by a relatively small proportion (for fewer than 10 units: 78 per cent considered these underpriced, 10 per cent seriously; for 10-50 units: 84 per cent considered these underpriced, 16 per cent seriously; for more than 50 units: 82 per cent considered these underpriced, 21 per cent seriously).
National fees as a percentage of typical costs incurred
To estimate the ratio between the percentage of respondents who considered the current schedule fee and the actual costs incurred, each of the answer bands was assigned an approximate percentage value representing the schedule fee as a proportion of the typical costs incurred:
- National fee is overpriced – schedule fee as 120 per cent of costs incurred.
- National fee is about right – schedule fee as 100 per cent of costs incurred.
- National fee is moderately underpriced – 87 per cent of costs incurred.
- National fee is significantly underpriced – 62 per cent of costs incurred.
- National fee is seriously underpriced – 40 per cent of costs incurred.
These percentages were then multiplied by the percentage of respondents who selected each answer, and the results for each application type were added together to produce an estimated overall figure for the current national fee as a percentage of the typical costs estimated by the full set of respondents. The reciprocals of these percentages were then multiplied by the fees set out in the national schedule to estimate the approximate typical costs incurred in processing and deciding each application type.
Table 4 shows the seven application types identified as having with the lowest estimates for the national schedule fee as a percentage of estimated costs incurred, along with their current schedule fees and estimated typical costs incurred based on these percentages.
Most of these application types were also among those most frequently considered underpriced in Table 3, with the exception of those concerning mineral acquisition. Removal or variation of conditions following grants of planning permission, discharge of condition(s), smaller waste applications and major outline applications were among the application types most frequently identified as being the most challenging in terms of cost recovery compared to their current national schedule fee(s).
Table 4: The seven most underpriced application types
|
Application type
|
Schedule fee as percentage of costs incurred |
National schedule fee(s) |
Estimated typical costs incurred |
|---|---|---|---|
| Removal or variation of a condition following grant of planning permission (major) |
57% |
£2,000 |
£3,500 |
| Discharge of condition(s) |
62% |
£86 or £298 depending on type |
£140 or £480 depending on type |
| Other operations for the winning and working of minerals (not more than 15 hectares) |
63% |
£321 per 0.1 hectares |
£500 per 0.1 hectares |
| Operations drilling for oil or natural gas (not more than 7.5 hectares) |
63% |
£698 per 0.1 hectares |
£1,100 per 0.1 hectares |
| Waste (not more than 15 hectares) |
64% |
£321 per 0.1 hectares |
£500 per 0.1 hectares |
| Outline applications (major) |
64% |
From £635 per 0.1 hectares to £205,943 maximum |
From £1,000 per 0.1 hectares to £320,000 maximum |
| Removal or variation of a condition following grant of planning permission (non-major) |
64% |
£586 |
£920 |
Note: estimated typical costs have been rounded to two significant figures.
Application types most often prioritised for review of fees
Neither the proportion of respondents who viewed an application type as underpriced, nor the estimated schedule fee as a percentage of costs incurred, necessarily indicates which application types pose the greatest challenges to councils. An application type that appears only slightly underpriced could still create substantial difficulties if the cost per application is high, the volume of applications is large, or both.
To identify which application types respondents believed represent the greatest overall issues, they were shown a list of the application types they had indicated were either moderately, significantly or seriously underpriced. They were then asked to select up to three that they thought should be prioritised for adjustment to better reflect full cost recovery, if the government were to review specific nationally set fees.
Table 5 shows the top ten application types selected by respondents as one of their three priorities for review of fees, along with the percentage of respondents considering them underpriced and the estimated schedule fee as a percentage of costs incurred, from the previous question.
Table 5: Top ten application types prioritised for fee review
|
Application type
|
% in top 3 |
% considered underpriced |
Fee as % of costs incurred |
|---|---|---|---|
| Removal or variation of a condition following grant of planning permission (major) |
39% |
92% |
57% |
| Discharge of condition(s) |
35% |
92% |
62% |
| Outline applications (major) |
32% |
88% |
64% |
| Householder applications |
23% |
64% |
83% |
| Erection of dwellings (major - more than 50 units) |
21% |
79% |
72% |
| Erection of dwellings (non-major - fewer than 10 units) |
17% |
87% |
70% |
| Erection of dwellings (medium/major - 10-50 units) |
17% |
82% |
70% |
| Prior approval (under the permitted development rights listed) |
16% |
83% |
70% |
| Removal or variation of a condition following grant of planning permission (non-major) |
11% |
88% |
64% |
| Lawful development certificate(s) (existing use) |
7% |
74% |
74% |
These results show that:
- Several application types already identified as having the greatest amounts of under-pricing were also among the most frequently selected as respondents’ top three priorities – chief among them removal or variation of conditions following grant of planning permission, discharge of conditions and major outline applications.
- Other application types with a lesser unit difference between the schedule fee and actual costs incurred were also very frequently selected as priorities for review of fee levels. Most notably, householder applications, whilst being the application type identified least often as underpriced, and with the second highest schedule fee relative to typical costs incurred, was nevertheless identified as among the top three application types to review and adjust by 23 per cent of respondents. This is likely to be the result of the sheer volume of applications of this type, which would make even a relatively small unit difference between fees and costs result in a considerable financial loss in the aggregate. A similar dynamic is also likely to underlie the relatively frequent prioritisation of erections of dwellings at all three levels of magnitude.
- Whilst respondents indicated that all planning application types generated a significant discrepancy between fees charged and costs incurred, the ten application types in Table 5 are those that respondents would have liked to see adjusted as a priority at the time of responding to the survey.
Appendix A provides a complete breakdown of the results for each planning application type, along with the extent to which the fees for that type are considered underpriced, the estimated schedule fee as a percentage of typical costs, the current costs laid out in the schedule, and the estimated costs incurred.
Fee schedule suggestions besides fee levels
Respondents were asked to share what, if anything, other than levels of fees, they would add, remove or otherwise improve or change in the current national fee schedule. Their comments and suggestions were classified into key topics and themes, which are described below from high to low frequency.
Suggested additions to the national fee schedule
- Fees for listed buildings. By far the most frequent suggestion was to introduce fees for listed building consent applications. Respondents acknowledged that whilst the absence of a fee has encouraged applications and prevented unauthorised works, a fee is becoming necessary to ensure that councils are able to secure the appropriate specialist resources.
- Tree preservation orders - another common suggested addition was to introduce fees for tree preservation order and tree works applications. Respondents noted that these orders often required a significant amount of resource to process, so at least a minimal fee for recovery of administrative expenses would be appropriate.
- Discharge of conditions - respondents suggested that these should be charged per condition, and/or need to be varied based on whether they are connected to major or non-major applications.
- Section 73 applications - alongside a revision of the fees, respondents argued for the necessity, particularly in the case of major applications, for the scope of these applications to be disaggregated from the original application type, as this can lead to significant variations in the level of work required.
- Prior approval - respondents suggested that too much variation exists in what is currently one set fee. Prior approval applications for new dwellings, minor changes and telecoms were particularly highlighted as in need of attention, as they often prove more complex than the equivalent planning application.
- Retrospective applications – respondents suggested that a higher fee should be charged for retrospective applications, particularly as a means to discourage undertaking works without permission.
Major applications
Respondents proposed disaggregating or adding more categories for complex and major applications, with these applications involving a wide variation in levels of workload and activity required, and thus seeing a greater variation in costs incurred.
Other suggestions included:
- Reviewing and increasing maximum or ‘capped’ fee levels.
- Introducing or increasing fees for compliance checks, Section 106 agreements, and monitoring.
- Introducing charges for lawful development certificates and certificates of lawfulness.
- Simplifying and/or clarifying the fee schedule and its categories.
- Introducing or increasing charges for advertising, demolition in conservation areas, and other applications which are currently free of charge.
- Introducing fees for cross-boundary applications, particularly cases where the smaller council in a cross-boundary case does not currently receive any fee.
- Introducing fees for environmental impact assessments (EIAs), including screening and scoping, appeals, and compliance.
- Introducing a surcharge for applications located in green belts.
- Charging for Section 211 notices, concerning trees in conservation areas.
- Charging for non-material amendments.
- Charging for enforcement-related applications.
Suggested removals from the national fee schedule
- Current reductions and exemptions - the most common suggestion was to remove or revise specific reductions or exemptions to fees, including the 50 per cent reduction for parish or community councils, or simplifying the schedule by removing some highly specialised exemptions or reductions.
- Maximum fee caps - there was also a call to eliminate all maximum fee caps, allowing fees to be set by adding the specified baseline to measures of the scale of the project without any specified maximum. Other respondents did not suggest removing the maximum fee altogether, but increasing it to as much as double its current value (from £411,885 to around £800,000).
- Change of use or outline applications - some respondents suggested that some fee categories are too generic, masking considerable variation in the actual applications received and the volume of work required to process and decide them. It might thus be preferable to remove these categories and reclassify applications currently received under them within more specific and appropriately priced categories. This included categories such as ‘changes of use of land’ and ‘outline applications’.
- Ambiguities or gaps - some respondents highlighted a lack of clarity over which householder fee category modifications such as electric vehicle chargers and ground source heat pumps fall under, with the current wording potentially resulting in higher fees than intended and thus undermining energy saving targets.
Costs and fee charges for discretionary fees
To provide a rounded picture of how different types of fees make up a council’s income picture, our survey included a snapshot of how councils are charging for discretionary services such as for pre-application advice and Planning Performance Agreements (PPAs). This included asking for some summary/broad information about income and how discretionary fees are structured.
Pre-application fees
Respondents were asked if their council currently charges for pre-application advice. As Table 6 shows, virtually all respondents (97 per cent) said that they charge for pre-application advice for at least some applications, with 68 per cent charging for all applications and 29 per cent charging for some applications. Only 3 per cent said they do not charge for pre-application advice for any applications.
Table 6: Does your council currently charge for pre-application advice?
|
Per cent |
|
|---|---|
| Yes (total) |
97% |
| Yes, for all applications |
68% |
| Yes, for some applications |
29% |
| No, we do not charge for pre-application advice |
3% |
Base: all respondents who answered the question (146 respondents)
Income from pre-application fees
Respondents who indicated that they charge for pre-application advice for at least some applications were asked to provide or estimate their council’s annual income from pre-application fees for the 2024/25 financial year, the most recent concluded financial year at the time of the survey. Table 7 displays some summary statistics based on estimates of annual income from pre-application fees for the 2024/25 financial year. Highlights included:
- On average, councils charging for pre-application advice received around £162,300 (within a range of £4,000 to a maximum of over £1.2 million).
- Those councils charging pre-application fees for all applications tended to have a higher average income – £169,400 – than those who charged for only some applications – £141,700.
The income reported by London Boroughs is substantially higher than for other types of council, at an average of £464,500 and ranging from £170,000 to almost £1.1 million.
Table 7: Annual pre-application advice income, 2024/25
|
Minimum council |
Average council |
Maximum council |
|
|---|---|---|---|
| All councils that charge for pre-application advice |
£4,000 |
£162,300 |
£1,234,000 |
| Councils that charge for all applications |
£4,000 |
£169,400 |
£1,234,000 |
| Councils that charge for some applications |
£5,000 |
£141,700 |
£780,000 |
| All London boroughs that charge for all or some applications |
£170,000 |
£464,500 |
£1,083,000 |
Base: all respondents who answered this question (117 respondents). Estimates have been rounded to the nearest hundred.
Respondents were asked to provide information about how pre-application fees are calculated. As Table 8 shows, over 80 per cent of respondents whose councils charged for pre-application advice included the costs of officer salaries, almost 70 per cent included the costs of specialist input and consultation, such as heritage and ecology, just over 50 per cent included corporate overheads such as building and IT costs, and a quarter included other factors including benchmarking with other authorities.
Table 8: What factors are included when your council's pre-application fees are calculated?
|
Per cent |
|
|---|---|
| Officer salaries (including pensions, national insurance, training, sick leave etc) |
82% |
| Specialist input and consultation (e.g. heritage, ecology etc) |
69% |
| Corporate overheads (e.g building costs, equipment, IT and support services) |
57% |
| Other (please specify) |
25% |
Base: all respondents who charged for pre-application advice (142 respondents).
Respondents whose councils charged for pre-application advice were also asked whether they used an (officer) hourly rate as a basis for their fee setting. As Table 9 shows, 40 per cent used an hourly rate, 57 per cent did not, with 6 per cent answering that they did not know at the time of responding.
Table 9: Are your council's pre-application fees based on an officer hourly rate?
|
Per cent |
|
|---|---|
| Yes |
37% |
| No |
57% |
| Don’t know |
6% |
Base: all respondents who answered the question (141 respondents).
Respondents who indicated that they use an hourly rate to calculate pre-application fees were asked to provide that hourly rate. As Table 10 shows, rates were charged at an average rate of £84 per hour (with a range of between £28 per hour and£250 per hour). The rates charged by London boroughs were higher, at an average of £101 per hour and a minimum of £70 per hour, although the maximum of £120 per hour was less than the maximum hourly rate across all respondents.
Table 10: Pre-application advice hourly rates
|
Minimum council |
Average council |
Maximum council |
|
|---|---|---|---|
| All councils that charge an hourly rate |
£28 |
£84 |
£250 |
| London boroughs that charge an hourly rate |
£70 |
£101 |
£120 |
Base: all respondents who answered this question (30 respondents). Estimates have been rounded to the nearest pound.
Respondents whose pre-application fees were not based on an hourly rate were asked on what basis their council calculated these fees. As Table 11 shows, the most common alternative method was benchmarking with other councils (three quarters of respondents), followed by benchmarking against the council’s own historic fee rates (48 per cent), other methods (28 per cent), and recording time input by council staff (14 per cent).10 per cent reported using the PAS pre-application fee calculator tool.
Table 11: On what basis does your council calculate its pre-application fees?
|
Per cent |
|
|---|---|
| Benchmarking with other councils |
75% |
| Benchmarking against the council's historic fee rates |
48% |
| Other (please specify) |
28% |
| Recording time input by council staff |
14% |
| Negotiation between the applicant and the council on an individual basis |
10% |
| Using the PAS pre-application fee calculator tool |
10% |
| Don’t know |
0% |
Base: all respondents who charged for pre-application advice and did not use an hourly rate to calculate these fees (80 respondents).
Charged-for PPAs with local developers (excluding NSIPs)
Respondents were asked whether their council currently enters into charged-for planning performance agreements (PPAs) with developers for local planning applications – this was distinguished from PPAs for nationally significant infrastructure projects (NSIPs), which were covered in a separate suite of questions in the survey. As Table 12 shows, almost 80 per cent of respondents said that they enter into PPAs with local developers, with 20 per cent saying that they do not, and 1 per cent saying that they did not know.
Table 12: Does your council currently enter into charged-for planning performance agreements (PPAs) with developers for local planning applications (excluding nationally significant infrastructure projects, or NSIPS)?
|
Per cent |
|
|---|---|
| Yes |
79% |
| No |
20% |
| Don’t know |
1% |
Base: all respondents who answered the question (146 respondents).
Respondents who said their council entered into PPAs with local developers were asked to provide their income from PPA charges for the 2024/25 financial year. As Table 13 shows, the average income from these PPA charges was approximately £265,600 per council, and £723,800 for London boroughs. These figures varied widely between the minimum and maximum provided, rising from a magnitude of thousands to millions depending on each council’s circumstances.
Table 13: Income from PPA charges, 2024/25
|
Minimum council |
Average council |
Maximum council |
|
|---|---|---|---|
| All councils that enter into PPAs |
£8,000 |
£265,600 |
£2,500,000 |
| London boroughs that enter into PPAs |
£166,100 |
£723,800 |
£2,500,000 |
Base: all respondents who answered this question (144 respondents). Estimates have been rounded to the nearest hundred.
Respondents were asked to provide the factors included when their council’s PPA charges are calculated. As Table 14 shows, 95 per cent of respondents who enter into charged-for local PPAs include officer salaries in their fee calculations, followed by specialist input and consultation (90 per cent), corporate overheads (62 per cent) and other considerations (23 per cent).
Table 14: What factors are included when your council's PPA charges are calculated?
|
Per cent |
|
|---|---|
| Officer salaries |
95% |
| Specialist input and consultation (e.g. heritage, ecology etc) |
90% |
| Corporate overheads (e.g. building costs, equipment, IT and support services) |
62% |
| Other (please specify) |
23% |
Base: all respondents who charged for pre-application advice (142 respondents).
Respondents who entered into local PPAs were asked if their PPA fees were based on an officer hourly rate. Just over half (56 per cent) reported that their fees are based on an hourly rate, whilst just under 40 per cent said that they were not, whilst 4 per cent did not know.
Table 15: Are your council's PPA fees based on an officer hourly rate?
|
Per cent |
|
|---|---|
| Yes |
56% |
| No |
39% |
| Don’t know |
4% |
Base: all respondents who answered the question (114 respondents).
Respondents who said their PPA fees were based on an hourly rate were asked to provide that rate. As Table 16 shows, the average rate across all councils which provided figures was £91 per hour, ranging from a minimum of £30 per hour to a maximum of £250 per hour. It should be noted that these figures were not available separately for London boroughs, since only one London borough provided a figure for an hourly rate.
Table 16: Local PPA hourly rates
|
Minimum council |
Average council |
Maximum council |
|
|---|---|---|---|
| All councils that enter into charged-for local PPAs |
£30 |
£91 |
£250 |
Base: all respondents who answered this question (75 respondents). Estimates have been rounded to the nearest pound.
Respondents whose PPA fees were not based on an hourly rate were asked on what basis their council calculated these fees. As Table 17 shows, the most frequent method was negotiating with the applicant on an individual basis (78 per cent of applicable respondents), followed by benchmarking with other councils (44 per cent), benchmarking against the council’s own historic fee rates (31 per cent), other considerations (27 per cent), recording time input by council staff (16 per cent), and using the PAS pre-application fee calculator tool (11 per cent).
Table 17: On what basis does your council calculate its PPA fees?
|
Per cent |
|
|---|---|
| Negotiation between the applicant and the council on an individual basis |
78% |
| Benchmarking with other councils |
44% |
| Benchmarking against the council's historic fee rates |
31% |
| Other (please specify) |
27% |
| Recording time input by council staff |
16% |
| Using the PAS pre-application fee calculator tool |
11% |
| Don’t know |
0% |
Base: all respondents who charged for local PPAs and did not use an hourly rate to calculate these fees (45 respondents).
Statutory planning application fees
Work to estimate the cost of planning applications
Respondents were asked whether their council has carried out any work to calculate the actual cost of processing and deciding planning applications. As Table 18 shows, a total of 17 per cent answered ‘yes’, including 6 per cent who had carried out this work for all application types, and 11 per cent who had carried it out for some application types. The largest section of respondents, at 43 per cent, had not yet carried out any work in this area but were planning to, whilst 38 had no current plans to do so, and 1 per cent did not know.
Table 18: Has your council carried out any work to calculate the actual cost of processing and deciding planning applications?
|
Per cent |
|
|---|---|
| Yes - total |
17% |
| Yes - for all planning application types |
6% |
| Yes - for certain planning application types (e.g. householder, major residential) |
11% |
| No, but we are planning to |
43% |
| No, and we have no current plans to |
38% |
| Don’t know |
1% |
Base: all respondents who answered this question (146 respondents).
Hourly rates for planning application fees
Respondents who indicated that their council had carried out work to estimate planning costs were asked if they had established an hourly rate, or range of rates, for planning application fees. As Table 19 shows, just under half (46 per cent) said that they had, whilst just over half (54 per cent) said that they had not.
Table 19: Has your council established an hourly rate, or range of rates, for planning application fees?
|
Number |
Per cent |
|
|---|---|---|
| Yes |
11 |
46% |
| No |
13 |
54% |
| Don’t know |
0 |
0% |
Base: all respondents who answered this question (24 respondents).
Respondents who indicated that they had established an hourly rate for planning application fees were asked to provide it. As Table 20 shows, the average rate among respondents who provided them was around £82 per hour, ranging from a minimum of £30 to a maximum of £120. It should be noted that these statistics are based on a very small number of reported hourly rates – five – and so they should be treated with considerable caution, although they do appear broadly in line with other hourly rates provided.
Table 20: Planning fee hourly rates
|
Minimum council |
Average council |
Maximum council |
|
|---|---|---|---|
| All councils that enter into charged-for local PPAs |
£30 |
£82 |
£120 |
Base: all respondents who answered this question (five respondents). Estimates have been rounded to the nearest pound.
Respondents who had established an hourly rate for planning applications were also asked what factors are included when calculating these rates. As Table 21 shows, all applicable respondents included specialist input and consultation, whilst all but one (91 per cent) included officer salaries, 82 per cent included corporate overheads, and two respondents included other considerations, which included officer time, meetings, site visits, and other processing costs such as publication and committee expenses.
Table 21: What factors are included when calculating your council's hourly rate for planning application fees?
|
Number |
Per cent |
|
|---|---|---|
| Specialist input and consultation (e.g. heritage, ecology etc) |
11 |
100% |
| Officer salaries (including pensions, national insurance, training, sick leave etc) |
10 |
91% |
| Corporate overheads (e.g building costs, equipment, IT and support services) |
9 |
82% |
| Other (please specify) |
2 |
18% |
Base: all respondents who had calculated an hourly rate for planning application fees (11 respondents).
Nationally significant infrastructure projects
Involvement in NSIPs and cost recovery
Respondents were asked whether their council had entered into a PPA with developers or promoters for nationally significant infrastructure projects (NSIPs). As Table 22 shows, just over a third (34 per cent) said that they had experience of PPAs for NSIPs in the last five years, whilst over half (59 per cent) said they had not, and 7 per cent said they did not know. If ‘don’t know’ responses were discounted, the percentage balance would be 37 per cent who had entered into PPAs for NSIPs compared to 63 per cent who had not.
Table 22: Since the 2020/21 financial year, has your council entered into any charged-for planning performance agreements (PPAs) with developers or project promoters for Nationally Significant Infrastructure Projects (NSIPs)?
|
Per cent |
|
|---|---|
| Yes |
34% |
| No |
59% |
| Don’t know |
7% |
Base: all respondents (147 respondents).
Respondents who had entered into PPAs for NSIPs in the previous five financial years were asked what proportion of the costs related to these NSIPs incurred by their council can usually be recovered.
They were asked to consider all stages of the NSIP process, from the pre-application to implementation stages. As Table 23 shows:
- Just over half (57 per cent) of respondents said they were able to recover half or more of the costs incurred, including 18 per cent who recovered all costs, 27 per cent who recovered a large majority, and 12 per cent who recovered a smaller majority of costs.
- A third (33 per cent) were able to recover less than half of the costs they incurred, divided into two even groups of around 16 per cent who recovered a significant minority of costs, and 16 per cent who recovered none or a small minority of costs, whilst ten per cent did not know what proportion of costs incurred they were able to recover.
- If ‘don’t know’ responses were excluded, the breakdown would be between 64 per cent who recovered half or more of costs incurred (including 20 per cent recovering all costs, 30 per cent recovering a large majority and 14 per cent recovering a smaller majority), and 36 per cent who recovered less than half of costs (including equal groups of 18 per cent recovering a significant minority of costs and none or a small minority of costs).
Table 23: What proportion of the costs related to NSIPs incurred by your council can usually be recovered?
|
Number |
Per cent |
|
|---|---|---|
| All costs (100%) |
9 |
18% |
| A large majority of costs (75-99%) |
13 |
27% |
| A majority of costs (50-74%) |
6 |
12% |
| A significant minority of costs (25-49%) |
8 |
16% |
| None or a small minority of costs (0-24%) |
8 |
16% |
| Don’t know |
5 |
10% |
Base: all respondents who answered the question (49 respondents).
The aggregate percentage of costs incurred for work on NSIPs that councils across the sector was able to recover was estimated by attributing the following figures for each response option:
- all costs: 100 per cent
- a large majority of costs: 87 per cent
- a majority of costs: 62 per cent
- a significant minority of costs: 37 per cent
- none or a small minority of costs: 12 per cent.
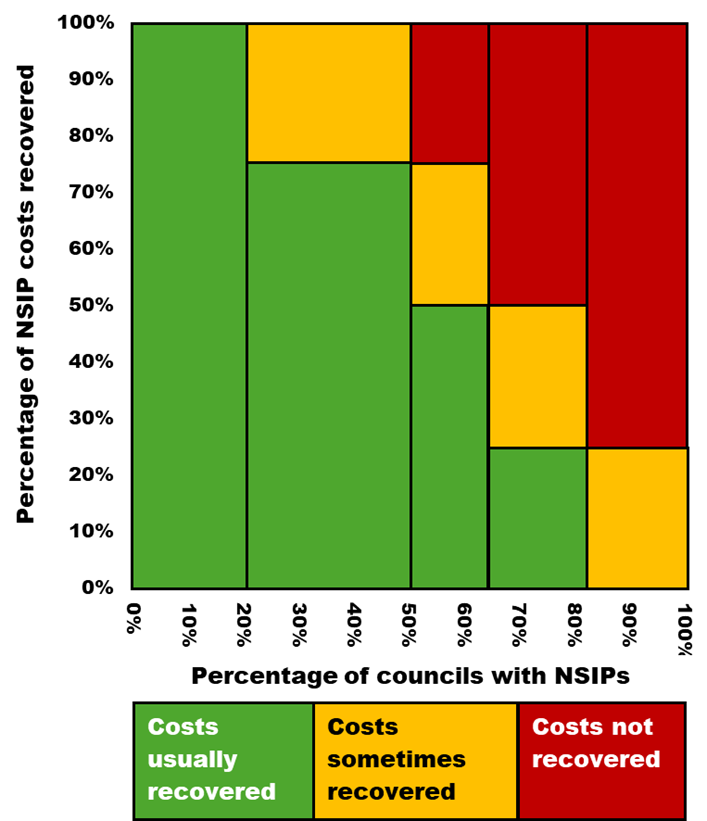
These percentages were then multiplied by the percentage of respondents (excluding those who said ‘don’t know’) who selected each option, and the total of these figures was obtained to estimate the overall percentage of costs incurred from NSIPs by councils. In all, it is estimated that approximately 64 per cent of NSIP costs were able to be recovered. This is represented in Figure 1, which shows the breakdown of costs recovered for council work on NSIPs (vertical axis) by percentage of respondent councils (horizontal axis), with the green areas representing costs that are usually recovered (as indicated by the lower limit of the option selected), amber areas representing costs that are sometimes recovered (as indicated by the range between the lower and upper limits of the option), and red areas representing costs that are not recovered (as indicated by the upper limit). A comparison of these areas shows that a fairly slim majority of the costs incurred might be expected to be recovered, whilst a significant minority of these costs would not.
Figure 1. Breakdown of percentage of NSIP costs recovered by respondent councils
Respondents whose councils had been involved in NSIPs were also asked how long it usually takes to negotiate and agree a PPA with an NSIP promoter or developer, incorporating the usual time taken from initial contact to signing a PPA, where one is successfully agreed.
As Table 24 shows, 36 per cent of these respondents said it usually takes them less than three months to negotiate a PPA for an NSIP, whilst a majority (62 per cent) said it usually takes them three months or more. This included 26 per cent taking at least three months but under six months, 22 per cent taking at least six months but under 12 months, and 14 per cent taking 12 months or more. One respondent did not know how long it usually takes.
Table 24: In your council's experience, how long does it usually take to negotiate and agree a PPA with an NSIP promoter or developer?
|
Number |
Per cent |
|
|---|---|---|
| Less than three months |
18 |
36% |
| Between three months and under six months |
13 |
26% |
| Between six months and under 12 months |
11 |
22% |
| 12 months or more |
7 |
14% |
| Don’t know |
1 |
2% |
Base: all respondents who had entered into PPAs for NSIPs since 2020/21 (50 respondents).
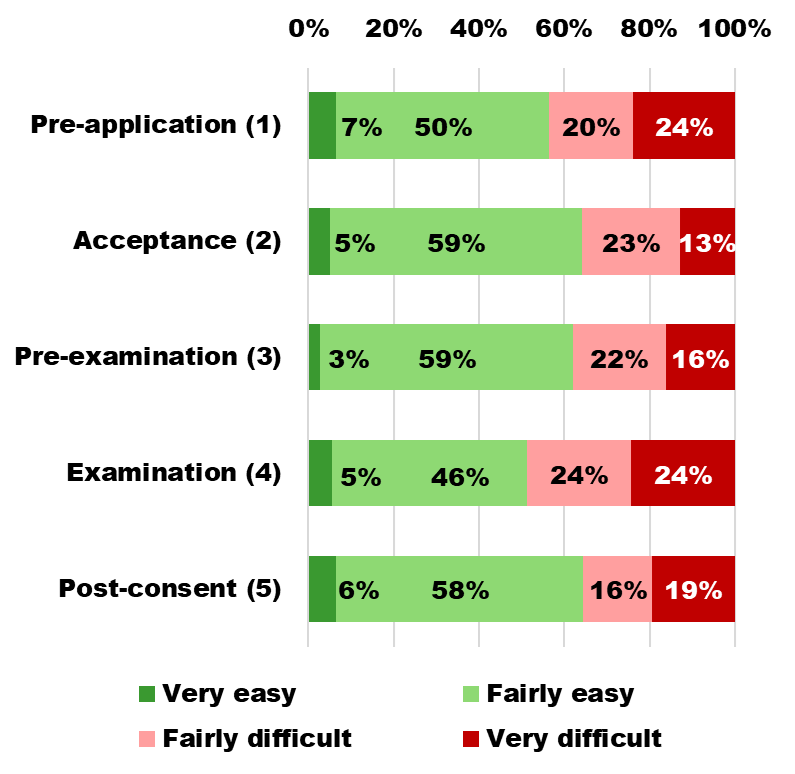
Respondents were asked how easy or difficult it is in their experience to recover the costs for work done at each stage of the NSIP process. As Table 25 and Figure 2 show, the stage of the NSIP process which respondents most often found easy to recover costs for was the post-consent stage, reported to be very or fairly easy by 65 per cent of respondents (excluding ‘don’t know’ responses), and very or fairly difficult by 35 per cent. The acceptance stage was similar, with 64 per cent finding it easy and 36 per cent finding it difficult, then by the pre-examination stage (62 per cent easy, 38 per cent difficult). The stages with the most difficulty were the examination stage (51 per cent easy, 48 per cent difficult), followed by the pre-application stage (57 per cent easy, 44 per cent difficult).
Table 25: In your experience, how easy or difficult is it to recover the costs for work done at each of the following stages of the NSIP process? Excluding ‘don’t know’
|
Very easy |
Fairly easy |
Fairly difficult |
Very difficult |
Base |
|
|---|---|---|---|---|---|
| Pre-application |
7% (3) |
50% (23) |
20% (9) |
24% (11) |
46 |
| Acceptance |
5% (2) |
59% (23) |
23% (9) |
13% (5) |
39 |
| Pre-examination |
3% (1) |
59% (22) |
22% (8) |
16% (6) |
37 |
| Examination |
5% (2) |
46% (17) |
24% (9) |
24% (9) |
37 |
| Post-consent |
6% (2) |
58% (18) |
16% (5) |
19% (6) |
31 |
Figure 2. In your experience, how easy or difficult is it to recover the costs for work done at each of the following stages of the NSIP process? Excluding ‘don’t know’
Support provided and basis for charges
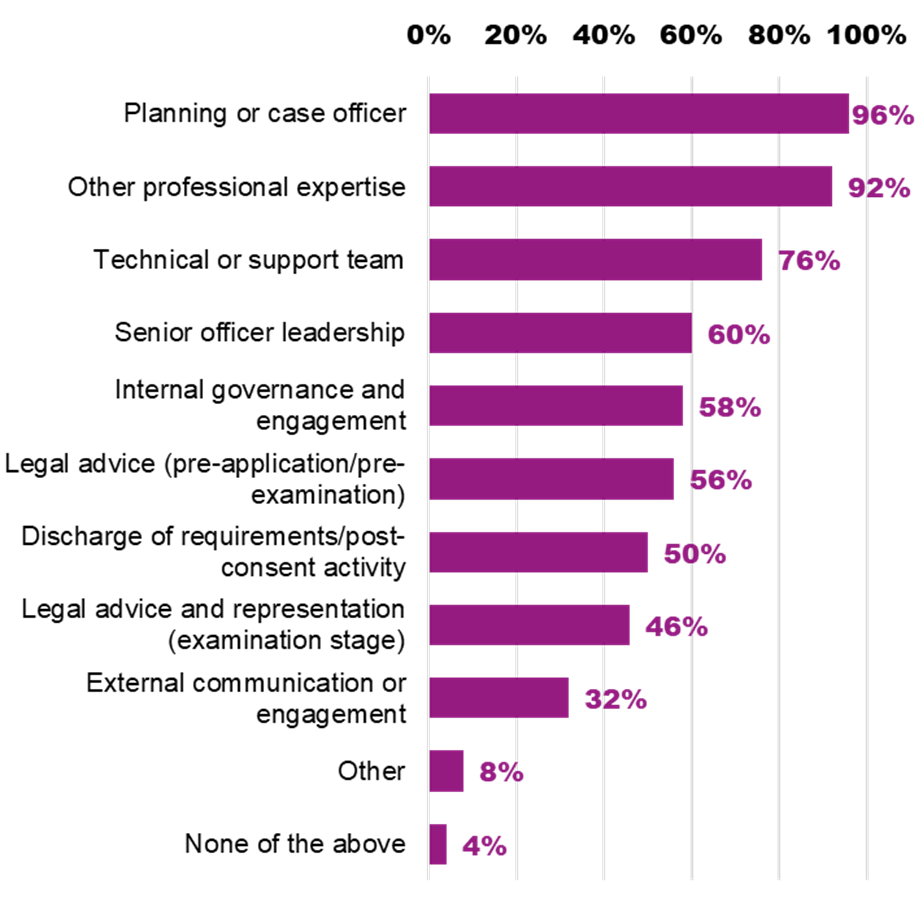
Respondents were asked what support, if any, their council usually provided within a PPA for NSIPs. As Table 26 and Figure 3 show, the most common forms of support provided for NSIPs were planning and/or case officer expertise (96 per cent), professional expertise from other professions (92 per cent), including highways, archaeology, ecology, flood risk, environmental health, and any expertise secured externally, technical or support teams (76 per cent), and senior officer leadership (60 per cent).
Less common forms of provision included:
- legal advice before and during the examination stage (56 per cent and 46 per cent respectively),
- discharge of requirements and other post-consent activity (50 per cent), and
- external communication or engagement (32 per cent).
Table 26: What support, if any, does your council usually provide within a PPA for NSIPs?
|
Number |
Per cent |
|
|---|---|---|
| Planning officer and/or case officer |
48 |
96% |
| Professional expertise from other professions |
46 |
92% |
| Technical team or support team |
38 |
76% |
| Senior officer leadership |
30 |
60% |
| Internal governance and engagement |
29 |
58% |
| Legal advice at the pre-application and pre-examination stages |
28 |
56% |
| Discharge of requirements and other post-consent activity |
25 |
50% |
| Legal advice and representation at the examination stage |
23 |
46% |
| External communication or engagement |
16 |
32% |
| Other (please specify) |
4 |
8% |
| None of the above |
2 |
4% |
Base: all respondents who had entered into PPAs for NSIPs since 2020/21 (50 respondents).
Figure 3. What support, if any, does your council usually provide within a PPA for NSIPs?
Factors for calculating PPA charges for NSIPs
Respondents were asked about the factors their council used to cost PPA charges for NSIPs and how they are usually calculated. As Table 27 shows, the factor most commonly used to calculate these fees was officer salaries, selected by 88 per cent of respondents, followed by specialist input and consultation costs (82 per cent), corporate overheads (60 per cent), and a collection of other factors (14 per cent), dependent on the specifics of the scheme such as an agreed corporate hourly charge, travel expenses and/or meetings, and legal advice costs.
Table 27: On which factors are your council's NSIP PPA charges usually calculated?
|
Number |
Per cent |
|
|---|---|---|
| Officer salaries |
44 |
88% |
| Specialist input and consultation (e.g. heritage, ecology etc) |
41 |
82% |
| Corporate overheads (e.g. building costs, equipment, IT and support services) |
30 |
60% |
| External professional input (e.g. consultants) or externally commissioned evidence (e.g. externally commissioned local impact report, etc) |
30 |
60% |
| Other (please specify) |
7 |
14% |
Base: all respondents who had entered into PPAs for NSIPs since 2020/21 (50 respondents).
Hourly rates for NSIPs
Respondents were asked whether their council’s PPA fees for NSIPs were largely based on an hourly rate. As Table 28 shows, a substantial majority (73 per cent) of respondents whose councils had entered into NSIP PPAs since 2020/21 based their fees largely on an hourly rate, with 20 per cent saying that they were not, and three respondents who did not know. Excluding those who answered ‘don’t know’, 79 per cent of these respondents based their fees on an hourly rate, and 21 per cent did not.
Table 28: Are your council's NSIP PPA fees largely based on an hourly rate?
|
Number |
Per cent |
|
|---|---|---|
| Yes |
37 |
73% |
| No |
10 |
20% |
| Don’t know |
3 |
6% |
Base: all respondents who had entered into PPAs for NSIPs since 2020/21 (50 respondents).
Respondents who reported that their NSIP PPA fees are largely based on an hourly rate were asked to provide that hourly rate. As Table 29 shows, the average rate from those councils which provided data was £92 per hour, ranging from £45 per hour to £250 per hour. The average was higher among applicable London boroughs, at £163 per hour, with a higher minimum of £75 per hour. It should be noted that these figures are based on a small number of responses (19), so should be treated with caution, although they appear broadly in line with other hourly rates provided.
Table 29: Hourly rates used to calculate NSIP fees
|
Minimum council |
Average council |
Maximum council |
|
|---|---|---|---|
| All councils that base NSIP PPA fees on an hourly rate |
£45 |
£92 |
£250 |
| London boroughs that base NSIP PPA fees on an hourly rate |
£75 |
£163 |
£250 |
Base: all respondents who answered this question (19 respondents). Estimates have been rounded to the nearest pound.
Work to estimate NSIP costs and time
Respondents were asked whether their council consistently records the amount of time spent by council officers on NSIP-related work, with timesheets given as one example. As Table 30 shows, a majority (59 per cent) said that this is the case, with 31 per cent saying that this is not recorded, and 8 per cent saying they do not know. If respondents who answered ‘don’t know’ are excluded, 65 per cent said that they record officer time spent on NSIPs, whilst 35 per cent said that they do not.
Table 30: Does your council consistently record the amount of time spent by council officers on NSIP-related work, for example, using timesheets?
|
Number |
Per cent |
|
|---|---|---|
| Yes |
30 |
59% |
| No |
16 |
31% |
| Don’t know |
4 |
8% |
Base: all respondents who had entered into PPAs for NSIPs since 2020/21 (50 respondents).
Respondents were asked whether their council reports the amount of time spent on NSIPs, in order to determine the costs chargeable by the council. As Table 31 shows, three-quarters (75 per cent) said that their council does this, whilst 18 per cent said that their council did not, whilst 7 per cent did not know. If respondents who answered ‘don’t know’ are excluded, 81 per cent said that their council reports time spent on NSIPs to determine chargeable costs, whilst 19 per cent their council did not.
Table 31: Does your council consistently record the amount of time spent by council officers on NSIP-related work, for example, using timesheets?
|
Number |
Per cent |
|
|---|---|---|
| Yes |
21 |
75% |
| No |
5 |
18% |
| Don’t know |
2 |
7% |
Base: all respondents who answered this question (28 respondents).
Payment schedule for NSIPs
Respondents were asked to specify the payment schedule that determines their council receiving payments for its work on NSIPs. As Table 32 shows, a majority (58 per cent) said that their council’s payment schedule is based on an activity report on a quarterly basis, or other agreed regular basis, whilst just over a third (34 per cent) said that payments are determined by meeting agreed milestones or trigger points. One respondent specified another means of determining when their council received payments, which was a method involving upfront payment from an applicant by way of a purchase order, whilst three respondents did not know. Excluding respondents who answered ‘don’t know’, 62 per cent are paid for their work on NSIPs on an agreed periodic basis, whilst 36 per cent are paid based on meeting agreed milestones.
Table 32: What is the payment schedule that determines your council receiving payments for its work on NSIPs?
|
Number |
Per cent |
|
|---|---|---|
| Payments against an activity report on a quarterly or other agreed regular basis |
29 |
58% |
| Payments on meeting agreed milestones or trigger points |
17 |
34% |
| Other (please specify) |
1 |
2% |
| Don't know |
3 |
6% |
Base: all respondents who had entered into PPAs for NSIPs since 2020/21 (50 respondents).
Further comments on NSIPs
Respondents were asked whether they had anything else that they would like to share about PPAs and cost recovery for NSIPs specifically. Twenty-one respondents provided additional comments on this topic, and their responses have been grouped into the following broad themes:
- The difficulty of achieving full cost recovery in this area. Many respondents noted that even within PPAs, securing full cost recovery was difficult, whilst others mentioned that frequent NSIP applicants are often reluctant to enter into a PPA, as they do not wish to set a precedent for future applications. Some respondents expressed that they feel the establishment of PPAs for NSIPs should become a statutory necessity.
- Issues caused by resource and staffing constraints. Some respondents mentioned that even if funding were not a concern, recruiting and retaining staff with the appropriate specialist skills would remain a significant challenge, especially when these skills may not be required in periods in which NSIPs are not being conducted. Some mentioned being required to use consultancy firms to secure the necessary expertise, resulting in substantially higher costs.
- Complexity and administrative burdens. It was widely reported that the process of negotiating, evidencing and managing PPAs for NSIPs is highly complex, time-consuming and administratively intensive, even when compared with other planning applications.
- Variability in the willingness of NSIP developers to pay for certain activities, such as legal costs, or to pay levels of fees required to achieve full cost recovery. As mentioned above, some developers were described as reluctant to enter into PPAs.
- A need for nationwide standardisation. Several respondents called for a national template for NSIP PPAs and chargeable activities, or centrally established fees for NSIPs.
- The importance of benchmarking and reasonableness judgements. Several respondents highlighted the need to frame and assess cost calculations relative to the fees charged by other councils and by assessments of experienced planning officers regarding what level of fees are reasonable.
- The importance of payment schedules and the need for certainty of income. This was highlighted as especially important in order to the income required to support new specialised staff specific to the NSIP.
- The barriers often presented by legal costs and procurement processes, which some respondents identified as impediments to effective and timely cost recovery, especially where NSIP developers are unwilling to pay for legal costs.
Localised fee setting appetite and priorities
Appetite for setting localised fees
All respondents were asked whether their council would set its own localised planning application fees, if this was allowed by legislation. As Table 33 shows, a significant minority (29 per cent) said that they would set their own fees, whilst a majority (58 per cent) said that they might do so. A small minority (8 per cent) said that they would not set their own fees, whilst 5 per cent did not know what their council would do in this situation.
Table 33: Would your council set its own localised planning application fees, if legislation allowed it?
|
Per cent |
|
|---|---|
| Yes - we would set our own fees |
29% |
| Possibly - we may or may not set our own fees |
58% |
| No - we would not set our own fees |
8% |
| Don't know |
5% |
Base: all respondents (147 respondents).
Challenges with localised fee setting
Respondents were asked what, if anything, they saw as the biggest challenges with localised fee setting. As Table 34 shows, the biggest anticipated challenges were:
- the resources required to establish evidence on costs and time spent in order to set, justify and periodically review fees (84 per cent),
- inconsistencies which may arise from variations in fees between councils (74 per cent), and
- investment being discouraged by higher fees (36 per cent).
Issues identified less frequently included the relationship between application fees and other discretionary fees (24 per cent), and the effect that localised fees may have on discretionary fee income (23 per cent).
More generally, respondents recorded the following challenges and concerns associated with localised fee setting:
- Concerns about the impact of local government reorganisation (LGR), and other structural uncertainties facing the local government sector, which may cause additional challenges and complexities in a context of localised fee setting.
- The need to align localised fees across local authorities, particularly neighbouring ones, making benchmarking especially important in this area.
- Raising expectations - Issues arising from applicants expecting more favourable outcomes where they have paid a higher fee than is charged in other areas, likely leading to increased complaints and requests to waive fees.
- Concerns about a ‘race to the bottom’ where some councils may set fees at an unsustainably low level to attract developers, leading to other councils with more reasonable fees losing investment.
- Political issues, including councillor opposition, especially a potential reluctance among councillors to support increased fees, and the need to secure member buy-in for any decisions made.
- Unpredictability and uncertainty around appropriate fee levels, given considerable variability in the time and cost required from application to application, requiring different levels and amounts of officer expertise.
- Uncertainty around systems and methods for the calculation, collection and management of fees.
- Concerns about increasing issues in recovering enforcement and compliance costs, as well as an increasing amount of unauthorised works.
Table 34: What, if anything, do you see as the biggest challenges with localised fee setting?
|
Per cent |
|
|---|---|
| The resources required to establish evidence on costs and time spent |
84% |
| Inconsistencies resulting from variations in fees between councils |
74% |
| Investment being discouraged by higher fees |
36% |
| The relationship between application fees and other discretionary fees |
24% |
| The effect localised fees may have on discretionary fee income |
23% |
| Other (please specify) |
18% |
Base: all respondents (147 respondents).
Co-designing a localised fee-setting model
Respondents were asked whether they would be willing to help test or co-design a localised fee-setting model. As Table 35 shows, 82 per cent indicated some level of willingness to participate in this exercise, including 23 per cent who were definitely interested and 59 per cent who were possibly interested and requested more information. Eighteen per cent indicated that they would not be interested in testing or co-designing a localised model of this kind.
Table 35: Would you be willing to help test or co-design a localised fee-setting model?
|
Per cent |
|
|---|---|
| Yes - definitely |
23% |
| Possibly - tell me more |
59% |
| No |
18% |
Base: all respondents (147 respondents).
Final comments
Respondents were asked if they had anything else they would like to share about the topics covered in this survey. Forty-seven respondents provided further comments, and their responses fell into the following broad themes, in order of descending frequency:
- Further elaboration on concerns around under-recovery of costs, and whether it is appropriate for all planning fees to be priced at a full cost recovery level.
- Questions and uncertainties about what costs are necessary or appropriate to be included in planning fees.
- Reiterated concerns about the potential difficulty of gaining political and/or public support for higher planning fees.
- A reiteration of the need for more nuanced fee categories in certain areas.
- Concerns about recruitment and retention of additional and/or specialised staff required to process and decide planning applications.
- Suggestions for collaboration between authorities, especially from and concerning national park authorities, in order to safeguard consistency and comparability between local areas.
- Issues caused by the costs of advertising in local newspapers, along with requests to review this topic.
- Calls for national guidance, standardisation, and/or a national formula for fee setting, along with caution about the prospect for localised fees and the need to establish consistency and coherence if any localisation is implemented.
- Further concerns around the potential impact local government reorganisation (LGR) on planning fees and fee setting, including a concern that reviewing the fee structure before certainty is reached on the new structure of local government could be counter-productive.
- Suggestions for regular review of fees, benchmarking, and the need for legislative clarity on amendments and monitoring.
- Offers to share data, participate in working groups, or be involved in future discussions on this topic.
Annex A: Full breakdown of planning application types
The following tables provide a summary of each planning application type from the following data sources:
- Responses to Question 1 of the survey: ‘How do the fees set out in the current national fee schedule compare with the typical costs incurred in processing and deciding those applications?’ Including:
- The total percentage of respondents who said the schedule fee was underpriced.
- The percentage for each individual response band.
- The base (number of respondents who answered the question for the application type in question).
- The ranking out of all application types for total per cent underpriced and per cent seriously underpriced.
- The estimated national fee as a percentage of typical costs, as calculated by the methodology detailed in the main body of this report.
- The ranking out of all application types for national fee as a percentage of costs (reversed so the highest percentage is ranked number 1).
- The current national schedule fees as set out in the schedule.
- Estimated typical costs incurred (rounded to two decimal places), calculated by applying the reciprocal of the estimated national fee as a percentage of typical costs to the schedule fees.
- The number and percentage of respondents who selected the application type as among the top three application types to prioritise for fee review.
- The ranking out of all application types for the percentage selecting the application type in the top three.
Table 36: Householder applications
|
Statistics |
|
|---|---|
| National schedule fee is underpriced – per cent |
64% |
| Seriously underpriced (under 50 per cent of costs) |
11% |
| Significantly underpriced (50-74 per cent of costs) |
17% |
| Moderately underpriced (75-99 per cent of costs) |
36% |
| About right (100 per cent of costs) |
35% |
| Overpriced (over 100 per cent of costs) |
2% |
| National fee pricing question – base |
127 |
| Total per cent underpriced – rank |
39 out of 39 |
| Seriously underpriced - rank |
36 out of 39 |
| Estimated national fee as per cent of typical costs |
83% |
| National fee as per cent of typical costs – rank |
38 out of 39 |
| Current national schedule fee(s) |
£528 |
| Estimated typical costs incurred |
£640 |
| In top three to be prioritised – number |
34 |
| In top three to be prioritised – per cent |
23% |
| In top three to be prioritised – rank |
4 out of 39 |
Table 37: Outline applications (non-major)
|
Statistics |
|
|---|---|
| National schedule fee is underpriced – per cent |
88% |
| Seriously underpriced (under 50 per cent of costs) |
13% |
| Significantly underpriced (50-74 per cent of costs) |
34% |
| Moderately underpriced (75-99 per cent of costs) |
40% |
| About right (100 per cent of costs) |
12% |
| Overpriced (over 100 per cent of costs) |
0% |
| National fee pricing question – base |
119 |
| Total per cent underpriced – rank |
3 out of 39 |
| Seriously underpriced - rank |
32 out of 39 |
| Estimated national fee as per cent of typical costs |
74% |
| National fee as per cent of typical costs – rank |
25 out of 39 |
| Current national schedule fee(s) |
£588 for each 0.1 hectare (or part thereof) |
| Estimated typical costs incurred |
£800 |
| In top three to be prioritised – number |
4 |
| In top three to be prioritised – per cent |
3% |
| In top three to be prioritised – rank |
17 out of 39 |
Table 38: Outline applications (major)
|
Statistics |
|
|---|---|
| National schedule fee is underpriced – per cent |
88% |
| Seriously underpriced (under 50 per cent of costs) |
35% |
| Significantly underpriced (50-74 per cent of costs) |
34% |
| Moderately underpriced (75-99 per cent of costs) |
19% |
| About right (100 per cent of costs) |
11% |
| Overpriced (over 100 per cent of costs) |
1% |
| National fee pricing question – base |
125 |
| Total per cent underpriced – rank |
4 out of 39 |
| Seriously underpriced - rank |
12 out of 39 |
| Estimated national fee as per cent of typical costs |
64% |
| National fee as per cent of typical costs – rank |
6 out of 39 |
| Current national schedule fee(s) |
£635 for each 0.1 hectare (or part thereof) £15,695 (more than 2.5 hectares) £189 for each 0.1 hectare over 2.5 hectares £205,943 maximum fee for more than 2.5 hectares |
| Estimated typical costs incurred |
£1,000, £25,000, £300 and £320,000 respectively |
| In top three to be prioritised – number |
47 |
| In top three to be prioritised – per cent |
32% |
| In top three to be prioritised – rank |
3 out of 39 |
Table 39: Permission in principle
|
Statistics |
|
|---|---|
| National schedule fee is underpriced – per cent |
76% |
| Seriously underpriced (under 50 per cent of costs) |
18% |
| Significantly underpriced (50-74 per cent of costs) |
29% |
| Moderately underpriced (75-99 per cent of costs) |
28% |
| About right (100 per cent of costs) |
24% |
| Overpriced (over 100 per cent of costs) |
0% |
| National fee pricing question – base |
92 |
| Total per cent underpriced – rank |
26 out of 39 |
| Seriously underpriced - rank |
28 out of 39 |
| Estimated national fee as per cent of typical costs |
74% |
| National fee as per cent of typical costs – rank |
27 out of 39 |
| Current national schedule fee(s) |
£512 for each 0.1 hectare (or part thereof) |
| Estimated typical costs incurred |
£690 |
| In top three to be prioritised – number |
5 |
| In top three to be prioritised – per cent |
3% |
| In top three to be prioritised – rank |
13 out of 39 |
Table 40: Enlargement or alterations to existing dwellings
|
Statistics |
|
|---|---|
| National schedule fee is underpriced – per cent |
65% |
| Seriously underpriced (under 50 per cent of costs) |
7% |
| Significantly underpriced (50-74 per cent of costs) |
22% |
| Moderately underpriced (75-99 per cent of costs) |
35% |
| About right (100 per cent of costs) |
34% |
| Overpriced (over 100 per cent of costs) |
2% |
| National fee pricing question – base |
124 |
| Total per cent underpriced – rank |
38 out of 39 |
| Seriously underpriced - rank |
39 out of 39 |
| Estimated national fee as per cent of typical costs |
83% |
| National fee as per cent of typical costs – rank |
39 out of 39 |
| Current national schedule fee(s) |
£528 for a single dwelling £1,043 for two or more |
| Estimated typical costs incurred |
£640 and £1,300 |
| In top three to be prioritised – number |
5 |
| In top three to be prioritised – per cent |
3% |
| In top three to be prioritised – rank |
13 out of 39 |
Table 41: Erection of dwellings (non-major - fewer than 10 units)
|
Statistics |
|
|---|---|
| National schedule fee is underpriced – per cent |
87% |
| Seriously underpriced (under 50 per cent of costs) |
21% |
| Significantly underpriced (50-74 per cent of costs) |
33% |
| Moderately underpriced (75-99 per cent of costs) |
32% |
| About right (100 per cent of costs) |
13% |
| Overpriced (over 100 per cent of costs) |
0% |
| National fee pricing question – base |
126 |
| Total per cent underpriced – rank |
7 out of 39 |
| Seriously underpriced - rank |
22 out of 39 |
| Estimated national fee as per cent of typical costs |
70% |
| National fee as per cent of typical costs – rank |
19 out of 39 |
| Current national schedule fee(s) |
£588 for each dwelling |
| Estimated typical costs incurred |
£840 |
| In top three to be prioritised – number |
25 |
| In top three to be prioritised – per cent |
17% |
| In top three to be prioritised – rank |
6 out of 39 |
Table 42: Erection of dwellings (medium/major - 10-50 units)
|
Statistics |
|
|---|---|
| National schedule fee is underpriced – per cent |
82% |
| Seriously underpriced (under 50 per cent of costs) |
23% |
| Significantly underpriced (50-74 per cent of costs) |
35% |
| Moderately underpriced (75-99 per cent of costs) |
23% |
| About right (100 per cent of costs) |
18% |
| Overpriced (over 100 per cent of costs) |
1% |
| National fee pricing question – base |
125 |
| Total per cent underpriced – rank |
17 out of 39 |
| Seriously underpriced - rank |
20 out of 39 |
| Estimated national fee as per cent of typical costs |
70% |
| National fee as per cent of typical costs – rank |
18 out of 39 |
| Current national schedule fee(s) |
£635 for each dwelling |
| Estimated typical costs incurred |
£910 |
| In top three to be prioritised – number |
25 |
| In top three to be prioritised – per cent |
17% |
| In top three to be prioritised – rank |
6 out of 39 |
Table 43: Erection of dwellings (major - more than 50 units)
|
Statistics |
|
|---|---|
| National schedule fee is underpriced – per cent |
79% |
| Seriously underpriced (under 50 per cent of costs) |
25% |
| Significantly underpriced (50-74 per cent of costs) |
25% |
| Moderately underpriced (75-99 per cent of costs) |
29% |
| About right (100 per cent of costs) |
20% |
| Overpriced (over 100 per cent of costs) |
2% |
| National fee pricing question – base |
122 |
| Total per cent underpriced – rank |
19 out of 39 |
| Seriously underpriced - rank |
19 out of 39 |
| Estimated national fee as per cent of typical costs |
72% |
| National fee as per cent of typical costs – rank |
23 out of 39 |
| Current national schedule fee(s) |
£31,385 flat fee £189 for each additional dwelling above 50 £411,885 maximum |
| Estimated typical costs incurred |
£43,000, £260 and £570,000 respectively |
| In top three to be prioritised – number |
31 |
| In top three to be prioritised – per cent |
21% |
| In top three to be prioritised – rank |
5 out of 39 |
Table 44: Erection of non-dwelling buildings (non-major)
|
Statistics |
|
|---|---|
| National schedule fee is underpriced – per cent |
77% |
| Seriously underpriced (under 50 per cent of costs) |
13% |
| Significantly underpriced (50-74 per cent of costs) |
35% |
| Moderately underpriced (75-99 per cent of costs) |
29% |
| About right (100 per cent of costs) |
23% |
| Overpriced (over 100 per cent of costs) |
0% |
| National fee pricing question – base |
129 |
| Total per cent underpriced – rank |
24 out of 39 |
| Seriously underpriced - rank |
33 out of 39 |
| Estimated national fee as per cent of typical costs |
75% |
| National fee as per cent of typical costs – rank |
31 out of 39 |
| Current national schedule fee(s) |
£298 no increase in gross floor space or <40 m2 £588 for each 75 m2 between 40 and 1,000 m2 |
| Estimated typical costs incurred |
£400 and £780 |
| In top three to be prioritised – number |
1 |
| In top three to be prioritised – per cent |
1% |
| In top three to be prioritised – rank |
28 out of 39 |
Table 45: Erection of non-dwelling buildings (major)
|
Statistics |
|
|---|---|
| National schedule fee is underpriced – per cent |
76% |
| Seriously underpriced (under 50 per cent of costs) |
14% |
| Significantly underpriced (50-74 per cent of costs) |
34% |
| Moderately underpriced (75-99 per cent of costs) |
28% |
| About right (100 per cent of costs) |
21% |
| Overpriced (over 100 per cent of costs) |
2% |
| National fee pricing question – base |
126 |
| Total per cent underpriced – rank |
25 out of 39 |
| Seriously underpriced - rank |
31 out of 39 |
| Estimated national fee as per cent of typical costs |
75% |
| National fee as per cent of typical costs – rank |
32 out of 39 |
| Current national schedule fee(s) |
£635 for each 75 m2 between 1,000-3,750 m2 £31,385 flat fee >3,750 m2 £189 for each 75 m2 above 3,750 m2 £411,885 maximum fee |
| Estimated typical costs incurred |
£850, £41,670, £250 and £550,000 respectively |
| In top three to be prioritised – number |
4 |
| In top three to be prioritised – per cent |
3% |
| In top three to be prioritised – rank |
17 out of 39 |
Table 46: Erection of buildings on agricultural land (non-major)
|
Statistics |
|
|---|---|
| National schedule fee is underpriced – per cent |
68% |
| Seriously underpriced (under 50 per cent of costs) |
20% |
| Significantly underpriced (50-74 per cent of costs) |
28% |
| Moderately underpriced (75-99 per cent of costs) |
20% |
| About right (100 per cent of costs) |
32% |
| Overpriced (over 100 per cent of costs) |
0% |
| National fee pricing question – base |
90 |
| Total per cent underpriced – rank |
35 out of 39 |
| Seriously underpriced - rank |
24 out of 39 |
| Estimated national fee as per cent of typical costs |
75% |
| National fee as per cent of typical costs – rank |
29 out of 39 |
| Current national schedule fee(s) |
£122 up to 465 m2 £588 for first 540 m2 over 465 m2 up to 540 m2 £588 for each 75 m2 above 540 m2 |
| Estimated typical costs incurred |
£160, £790 and £790 respectively |
| In top three to be prioritised – number |
5 |
| In top three to be prioritised – per cent |
3% |
| In top three to be prioritised – rank |
13 out of 39 |
Table 47: Erection of buildings on agricultural land (major)
|
Statistics |
|
|---|---|
| National schedule fee is underpriced – per cent |
69% |
| Seriously underpriced (under 50 per cent of costs) |
15% |
| Significantly underpriced (50-74 per cent of costs) |
28% |
| Moderately underpriced (75-99 per cent of costs) |
26% |
| About right (100 per cent of costs) |
31% |
| Overpriced (over 100 per cent of costs) |
0% |
| National fee pricing question – base |
86 |
| Total per cent underpriced – rank |
34 out of 39 |
| Seriously underpriced - rank |
30 out of 39 |
| Estimated national fee as per cent of typical costs |
77% |
| National fee as per cent of typical costs – rank |
34 out of 39 |
| Current national schedule fee(s) |
£5,077 for first 1,000 m2 £635 for each 75 m2 over 1,000 m2 up to 4,215 m2 £31,385 flat fee over £4,215 m2 £189 for each 75 m2 over 4,215 m2 £411,885 maximum fee |
| Estimated typical costs incurred |
£6,600, £830, £41,000, £250 and £530,000 |
| In top three to be prioritised – number |
0 |
| In top three to be prioritised – per cent |
0% |
| In top three to be prioritised – rank |
32 out of 32 |
Table 48: Erection/alterations/replacement of plant and machinery
|
Statistics |
|
|---|---|
| National schedule fee is underpriced – per cent |
65% |
| Seriously underpriced (under 50 per cent of costs) |
11% |
| Significantly underpriced (50-74 per cent of costs) |
25% |
| Moderately underpriced (75-99 per cent of costs) |
29% |
| About right (100 per cent of costs) |
35% |
| Overpriced (over 100 per cent of costs) |
0% |
| National fee pricing question – base |
103 |
| Total per cent underpriced – rank |
37 out of 39 |
| Seriously underpriced - rank |
37 out of 39 |
| Estimated national fee as per cent of typical costs |
80% |
| National fee as per cent of typical costs – rank |
37 out of 39 |
| Current national schedule fee(s) |
£588 for each 0.1 hectare under 1 hectare £635 for each 0.1 hectare, 1-5 hectares £31,385 flat fee, >5 hectares £189 for each 0.1 hectare over 5 hectares £411,885 maximum fee |
| Estimated typical costs incurred |
£730, £790, £39,000, £240 and £510,000 |
| In top three to be prioritised – number |
2 |
| In top three to be prioritised – per cent |
1% |
| In top three to be prioritised – rank |
23 out of 32 |
Table 49: Car parks, service roads, other access
|
Statistics |
|
|---|---|
| National schedule fee is underpriced – per cent |
76% |
| Seriously underpriced (under 50 per cent of costs) |
19% |
| Significantly underpriced (50-74 per cent of costs) |
25% |
| Moderately underpriced (75-99 per cent of costs) |
32% |
| About right (100 per cent of costs) |
24% |
| Overpriced (over 100 per cent of costs) |
0% |
| National fee pricing question – base |
107 |
| Total per cent underpriced – rank |
27 out of 39 |
| Seriously underpriced - rank |
27 out of 39 |
| Estimated national fee as per cent of typical costs |
75% |
| National fee as per cent of typical costs – rank |
30 out of 39 |
| Current national schedule fee(s) |
£298 |
| Estimated typical costs incurred |
£400 |
| In top three to be prioritised – number |
1 |
| In top three to be prioritised – per cent |
1% |
| In top three to be prioritised – rank |
28 out of 32 |
Table 50: Operations drilling for oil or natural gas (not more than 7.5 hectares)
|
Statistics |
|
|---|---|
| National schedule fee is underpriced – per cent |
72% |
| Seriously underpriced (under 50 per cent of costs) |
52% |
| Significantly underpriced (50-74 per cent of costs) |
12% |
| Moderately underpriced (75-99 per cent of costs) |
8% |
| About right (100 per cent of costs) |
28% |
| Overpriced (over 100 per cent of costs) |
0% |
| National fee pricing question – base |
25 |
| Total per cent underpriced – rank |
31 out of 39 |
| Seriously underpriced - rank |
1 out of 39 |
| Estimated national fee as per cent of typical costs |
63% |
| National fee as per cent of typical costs – rank |
4 out of 39 |
| Current national schedule fee(s) |
£698 for each 0.1 hectare |
| Estimated typical costs incurred |
£1,100 |
| In top three to be prioritised – number |
0 |
| In top three to be prioritised – per cent |
0% |
| In top three to be prioritised – rank |
32 out of 32 |
Table 51: Operations drilling for oil or natural gas (over 7.5 hectares)
|
Statistics |
|
|---|---|
| National schedule fee is underpriced – per cent |
67% |
| Seriously underpriced (under 50 per cent of costs) |
39% |
| Significantly underpriced (50-74 per cent of costs) |
28% |
| Moderately underpriced (75-99 per cent of costs) |
0% |
| About right (100 per cent of costs) |
33% |
| Overpriced (over 100 per cent of costs) |
0% |
| National fee pricing question – base |
18 |
| Total per cent underpriced – rank |
36 out of 39 |
| Seriously underpriced - rank |
4 out of 39 |
| Estimated national fee as per cent of typical costs |
66% |
| National fee as per cent of typical costs – rank |
13 out of 39 |
| Current national schedule fee(s) |
£52,269 flat fee, >75 hectares £207 for each 0.1 hectare above 7.5 hectares £411,885 maximum fee |
| Estimated typical costs incurred |
£79,000, £310, and £620,000 respectively |
| In top three to be prioritised – number |
0 |
| In top three to be prioritised – per cent |
0% |
| In top three to be prioritised – rank |
32 out of 32 |
Table 52: Operations other than drilling for, winning and working of oil or natural gas (not more than 15 hectares)
|
Statistics |
|
|---|---|
| National schedule fee is underpriced – per cent |
78% |
| Seriously underpriced (under 50 per cent of costs) |
39% |
| Significantly underpriced (50-74 per cent of costs) |
22% |
| Moderately underpriced (75-99 per cent of costs) |
17% |
| About right (100 per cent of costs) |
22% |
| Overpriced (over 100 per cent of costs) |
0% |
| National fee pricing question – base |
23 |
| Total per cent underpriced – rank |
21 out of 39 |
| Seriously underpriced - rank |
3 out of 39 |
| Estimated national fee as per cent of typical costs |
66% |
| National fee as per cent of typical costs – rank |
12 out of 39 |
| Current national schedule fee(s) |
£353 for each 0.1 hectare |
| Estimated typical costs incurred |
£540 |
| In top three to be prioritised – number |
2 |
| In top three to be prioritised – per cent |
1% |
| In top three to be prioritised – rank |
23 out of 32 |
Table 53: Operations other than drilling for, winning or working of oil or natural gas (over 15 hectares)
|
Statistics |
|
|---|---|
| National schedule fee is underpriced – per cent |
73% |
| Seriously underpriced (under 50 per cent of costs) |
36% |
| Significantly underpriced (50-74 per cent of costs) |
18% |
| Moderately underpriced (75-99 per cent of costs) |
18% |
| About right (100 per cent of costs) |
27% |
| Overpriced (over 100 per cent of costs) |
0% |
| National fee pricing question – base |
22 |
| Total per cent underpriced – rank |
30 out of 39 |
| Seriously underpriced - rank |
9 out of 39 |
| Estimated national fee as per cent of typical costs |
69% |
| National fee as per cent of typical costs – rank |
15 out of 39 |
| Current national schedule fee(s) |
£52,886 flat fee £207 for each 0.1 hectare over 15 hectares £107,090 maximum fee |
| Estimated typical costs incurred |
£77,000, £300 and £160,000 respectively |
| In top three to be prioritised – number |
0 |
| In top three to be prioritised – per cent |
0% |
| In top three to be prioritised – rank |
32 out of 32 |
Table 54: Other operations for the winning and working of minerals (not more than 15 hectares)
|
Statistics |
|
|---|---|
| National schedule fee is underpriced – per cent |
82% |
| Seriously underpriced (under 50 per cent of costs) |
35% |
| Significantly underpriced (50-74 per cent of costs) |
38% |
| Moderately underpriced (75-99 per cent of costs) |
9% |
| About right (100 per cent of costs) |
18% |
| Overpriced (over 100 per cent of costs) |
0% |
| National fee pricing question – base |
34 |
| Total per cent underpriced – rank |
15 out of 39 |
| Seriously underpriced - rank |
11 out of 39 |
| Estimated national fee as per cent of typical costs |
63% |
| National fee as per cent of typical costs – rank |
3 out of 39 |
| Current national schedule fee(s) |
£321 for each 0.1 hectare |
| Estimated typical costs incurred |
£510 |
| In top three to be prioritised – number |
0 |
| In top three to be prioritised – per cent |
0% |
| In top three to be prioritised – rank |
32 out of 32 |
Table 55: Other operations for the winning and working of minerals (over 15 hectares)
|
Statistics |
|
|---|---|
| National schedule fee is underpriced – per cent |
78% |
| Seriously underpriced (under 50 per cent of costs) |
34% |
| Significantly underpriced (50-74 per cent of costs) |
31% |
| Moderately underpriced (75-99 per cent of costs) |
13% |
| About right (100 per cent of costs) |
22% |
| Overpriced (over 100 per cent of costs) |
0% |
| National fee pricing question – base |
32 |
| Total per cent underpriced – rank |
23 out of 39 |
| Seriously underpriced - rank |
13 out of 39 |
| Estimated national fee as per cent of typical costs |
66% |
| National fee as per cent of typical costs – rank |
11 out of 39 |
| Current national schedule fee(s) |
£47,963 flat fee £189 for each 0.1 hectare £107,090 maximum fee |
| Estimated typical costs incurred |
£73,000, £290 and £160,000 respectively |
| In top three to be prioritised – number |
4 |
| In top three to be prioritised – per cent |
3% |
| In top three to be prioritised – rank |
17 out of 32 |
Table 56: Change of use of building to use as dwellinghouse (fewer than 10 units)
|
Statistics |
|
|---|---|
| National schedule fee is underpriced – per cent |
78% |
| Seriously underpriced (under 50 per cent of costs) |
10% |
| Significantly underpriced (50-74 per cent of costs) |
38% |
| Moderately underpriced (75-99 per cent of costs) |
30% |
| About right (100 per cent of costs) |
22% |
| Overpriced (over 100 per cent of costs) |
0% |
| National fee pricing question – base |
119 |
| Total per cent underpriced – rank |
22 out of 39 |
| Seriously underpriced - rank |
38 out of 39 |
| Estimated national fee as per cent of typical costs |
76% |
| National fee as per cent of typical costs – rank |
33 out of 39 |
| Current national schedule fee(s) |
£588 for each dwelling |
| Estimated typical costs incurred |
£780 |
| In top three to be prioritised – number |
0 |
| In top three to be prioritised – per cent |
0% |
| In top three to be prioritised – rank |
32 out of 32 |
Table 57: Change of use of building to use as dwellinghouse (medium/major - 10-50 units)
|
Statistics |
|
|---|---|
| National schedule fee is underpriced – per cent |
84% |
| Seriously underpriced (under 50 per cent of costs) |
16% |
| Significantly underpriced (50-74 per cent of costs) |
41% |
| Moderately underpriced (75-99 per cent of costs) |
27% |
| About right (100 per cent of costs) |
16% |
| Overpriced (over 100 per cent of costs) |
0% |
| National fee pricing question – base |
122 |
| Total per cent underpriced – rank |
13 out of 39 |
| Seriously underpriced - rank |
29 out of 39 |
| Estimated national fee as per cent of typical costs |
72% |
| National fee as per cent of typical costs – rank |
21 out of 39 |
| Current national schedule fee(s) |
£635 for each dwelling |
| Estimated typical costs incurred |
£890 |
| In top three to be prioritised – number |
1 |
| In top three to be prioritised – per cent |
1% |
| In top three to be prioritised – rank |
28 out of 32 |
Table 58: Change of use of building to use as dwellinghouse (major - more than 50 units)
|
Statistics |
|
|---|---|
| National schedule fee is underpriced – per cent |
82% |
| Seriously underpriced (under 50 per cent of costs) |
21% |
| Significantly underpriced (50-74 per cent of costs) |
33% |
| Moderately underpriced (75-99 per cent of costs) |
29% |
| About right (100 per cent of costs) |
16% |
| Overpriced (over 100 per cent of costs) |
2% |
| National fee pricing question – base |
112 |
| Total per cent underpriced – rank |
16 out of 39 |
| Seriously underpriced - rank |
23 out of 39 |
| Estimated national fee as per cent of typical costs |
72% |
| National fee as per cent of typical costs – rank |
22 out of 39 |
| Current national schedule fee(s) |
£31,385 flat fee £189 for each dwelling above 50 £411,885 maximum |
| Estimated typical costs incurred |
£44,000, £260 and £570,000 respectively |
| In top three to be prioritised – number |
3 |
| In top three to be prioritised – per cent |
2% |
| In top three to be prioritised – rank |
21 out of 32 |
Table 59: Other change of use of a building or land
|
Statistics |
|
|---|---|
| National schedule fee is underpriced – per cent |
85% |
| Seriously underpriced (under 50 per cent of costs) |
19% |
| Significantly underpriced (50-74 per cent of costs) |
31% |
| Moderately underpriced (75-99 per cent of costs) |
35% |
| About right (100 per cent of costs) |
14% |
| Overpriced (over 100 per cent of costs) |
1% |
| National fee pricing question – base |
124 |
| Total per cent underpriced – rank |
9 out of 39 |
| Seriously underpriced - rank |
26 out of 39 |
| Estimated national fee as per cent of typical costs |
72% |
| National fee as per cent of typical costs – rank |
24 out of 39 |
| Current national schedule fee(s) |
£588 |
| Estimated typical costs incurred |
£810 |
| In top three to be prioritised – number |
6 |
| In top three to be prioritised – per cent |
4% |
| In top three to be prioritised – rank |
11 out of 32 |
Table 60: Waste (not more than 15 hectares)
|
Statistics |
|
|---|---|
| National schedule fee is underpriced – per cent |
85% |
| Seriously underpriced (under 50 per cent of costs) |
32% |
| Significantly underpriced (50-74 per cent of costs) |
41% |
| Moderately underpriced (75-99 per cent of costs) |
12% |
| About right (100 per cent of costs) |
15% |
| Overpriced (over 100 per cent of costs) |
0% |
| National fee pricing question – base |
41 |
| Total per cent underpriced – rank |
10 out of 39 |
| Seriously underpriced - rank |
15 out of 39 |
| Estimated national fee as per cent of typical costs |
64% |
| National fee as per cent of typical costs – rank |
5 out of 39 |
| Current national schedule fee(s) |
£321 |
| Estimated typical costs incurred |
£500 |
| In top three to be prioritised – number |
1 |
| In top three to be prioritised – per cent |
1% |
| In top three to be prioritised – rank |
28 out of 32 |
Table 61: Waste (more than 15 hectares)
|
Statistics |
|
|---|---|
| National schedule fee is underpriced – per cent |
79% |
| Seriously underpriced (under 50 per cent of costs) |
32% |
| Significantly underpriced (50-74 per cent of costs) |
37% |
| Moderately underpriced (75-99 per cent of costs) |
11% |
| About right (100 per cent of costs) |
21% |
| Overpriced (over 100 per cent of costs) |
0% |
| National fee pricing question – base |
38 |
| Total per cent underpriced – rank |
18 out of 39 |
| Seriously underpriced - rank |
16 out of 39 |
| Estimated national fee as per cent of typical costs |
66% |
| National fee as per cent of typical costs – rank |
10 out of 39 |
| Current national schedule fee(s) |
£47,963 flat fee £189 for each 0.1 hectare over 15 hectares £107,090 maximum fee |
| Estimated typical costs incurred |
£73,000, £290 and £160,000 respectively |
| In top three to be prioritised – number |
5 |
| In top three to be prioritised – per cent |
3% |
| In top three to be prioritised – rank |
13 out of 32 |
Table 62: Lawful development certificate(s) (existing use)
|
Statistics |
|
|---|---|
| National schedule fee is underpriced – per cent |
74% |
| Seriously underpriced (under 50 per cent of costs) |
19% |
| Significantly underpriced (50-74 per cent of costs) |
29% |
| Moderately underpriced (75-99 per cent of costs) |
26% |
| About right (100 per cent of costs) |
26% |
| Overpriced (over 100 per cent of costs) |
0% |
| National fee pricing question – base |
129 |
| Total per cent underpriced – rank |
28 out of 39 |
| Seriously underpriced - rank |
25 out of 39 |
| Estimated national fee as per cent of typical costs |
74% |
| National fee as per cent of typical costs – rank |
26 out of 39 |
| Current national schedule fee(s) |
Same as full application fee |
| Estimated typical costs incurred |
Unavailable |
| In top three to be prioritised – number |
6 |
| In top three to be prioritised – per cent |
4% |
| In top three to be prioritised – rank |
11 out of 32 |
Table 63: Lawful development certificate(s) (proposed use)
|
Statistics |
|
|---|---|
| National schedule fee is underpriced – per cent |
69% |
| Seriously underpriced (under 50 per cent of costs) |
13% |
| Significantly underpriced (50-74 per cent of costs) |
23% |
| Moderately underpriced (75-99 per cent of costs) |
34% |
| About right (100 per cent of costs) |
31% |
| Overpriced (over 100 per cent of costs) |
0% |
| National fee pricing question – base |
128 |
| Total per cent underpriced – rank |
33 out of 39 |
| Seriously underpriced - rank |
34 out of 39 |
| Estimated national fee as per cent of typical costs |
80% |
| National fee as per cent of typical costs – rank |
36 out of 39 |
| Current national schedule fee(s) |
Half full application fee |
| Estimated typical costs incurred |
Unavailable |
| In top three to be prioritised – number |
3 |
| In top three to be prioritised – per cent |
2% |
| In top three to be prioritised – rank |
21 out of 32 |
Table 64: Prior approval (under the permitted development rights listed)
|
Statistics |
|
|---|---|
| National schedule fee is underpriced – per cent |
83% |
| Seriously underpriced (under 50 per cent of costs) |
28% |
| Significantly underpriced (50-74 per cent of costs) |
27% |
| Moderately underpriced (75-99 per cent of costs) |
28% |
| About right (100 per cent of costs) |
17% |
| Overpriced (over 100 per cent of costs) |
0% |
| National fee pricing question – base |
127 |
| Total per cent underpriced – rank |
14 out of 39 |
| Seriously underpriced - rank |
17 out of 39 |
| Estimated national fee as per cent of typical costs |
70% |
| National fee as per cent of typical costs – rank |
17 out of 39 |
| Current national schedule fee(s) |
£240 to £588 depending on type |
| Estimated typical costs incurred |
£350 to £850 |
| In top three to be prioritised – number |
24 |
| In top three to be prioritised – per cent |
16% |
| In top three to be prioritised – rank |
8 out of 32 |
Table 65: Prior approval (upward extensions to create new dwelling houses - fewer than 10 units)
|
Statistics |
|
|---|---|
| National schedule fee is underpriced – per cent |
86% |
| Seriously underpriced (under 50 per cent of costs) |
36% |
| Significantly underpriced (50-74 per cent of costs) |
32% |
| Moderately underpriced (75-99 per cent of costs) |
18% |
| About right (100 per cent of costs) |
14% |
| Overpriced (over 100 per cent of costs) |
0% |
| National fee pricing question – base |
92 |
| Total per cent underpriced – rank |
8 out of 39 |
| Seriously underpriced - rank |
10 out of 39 |
| Estimated national fee as per cent of typical costs |
64 per cent |
| National fee as per cent of typical costs – rank |
8 out of 39 |
| Current national schedule fee(s) |
£425 for each dwelling |
| Estimated typical costs incurred |
£660 for each dwelling |
| In top three to be prioritised – number |
2 |
| In top three to be prioritised – per cent |
1% |
| In top three to be prioritised – rank |
23 out of 32 |
Table 66: Prior approval (upward extensions to create new dwelling houses - 10-50 units)
|
Statistics |
|
|---|---|
| National schedule fee is underpriced – per cent |
87% |
| Seriously underpriced (under 50 per cent of costs) |
38% |
| Significantly underpriced (50-74 per cent of costs) |
24% |
| Moderately underpriced (75-99 per cent of costs) |
25% |
| About right (100 per cent of costs) |
13% |
| Overpriced (over 100 per cent of costs) |
0% |
| National fee pricing question – base |
87 |
| Total per cent underpriced – rank |
6 out of 39 |
| Seriously underpriced - rank |
6 out of 39 |
| Estimated national fee as per cent of typical costs |
65% |
| National fee as per cent of typical costs – rank |
9 out of 39 |
| Current national schedule fee(s) |
£459 for each dwelling |
| Estimated typical costs incurred |
£710 for each dwelling |
| In top three to be prioritised – number |
0 |
| In top three to be prioritised – per cent |
0% |
| In top three to be prioritised – rank |
32 out of 32 |
Table 67: Prior approval (upward extensions to create new dwelling houses - more than 50 units)
|
Statistics |
|
|---|---|
| National schedule fee is underpriced – per cent |
85% |
| Seriously underpriced (under 50 per cent of costs) |
37% |
| Significantly underpriced (50-74 per cent of costs) |
20% |
| Moderately underpriced (75-99 per cent of costs) |
28% |
| About right (100 per cent of costs) |
15% |
| Overpriced (over 100 per cent of costs) |
0% |
| National fee pricing question – base |
81 |
| Total per cent underpriced – rank |
11 out of 39 |
| Seriously underpriced - rank |
8 out of 39 |
| Estimated national fee as per cent of typical costs |
67% |
| National fee as per cent of typical costs – rank |
14 out of 39 |
| Current national schedule fee(s) |
£22,688 flat fee £137 for each dwelling above 50 £411,885 maximum fee |
| Estimated typical costs incurred |
£34,000, £200 and £620,000 respectively |
| In top three to be prioritised – number |
2 |
| In top three to be prioritised – per cent |
1% |
| In top three to be prioritised – rank |
23 out of 32 |
Table 68: Removal or variation of a condition following grant of planning permission (for example, Section 73s) (householder)
|
Statistics |
|
|---|---|
| National schedule fee is underpriced – per cent |
78% |
| Seriously underpriced (under 50 per cent of costs) |
32% |
| Significantly underpriced (50-74 per cent of costs) |
22% |
| Moderately underpriced (75-99 per cent of costs) |
25% |
| About right (100 per cent of costs) |
22% |
| Overpriced (over 100 per cent of costs) |
0% |
| National fee pricing question – base |
125 |
| Total per cent underpriced – rank |
20 out of 39 |
| Seriously underpriced - rank |
14 out of 39 |
| Estimated national fee as per cent of typical costs |
69% |
| National fee as per cent of typical costs – rank |
24 out of |
| Current national schedule fee(s) |
£86 |
| Estimated typical costs incurred |
£120 |
| In top three to be prioritised – number |
2 |
| In top three to be prioritised – per cent |
1% |
| In top three to be prioritised – rank |
23 out of 32 |
Table 69: Removal or variation of a condition following grant of planning permission (for example, Section 73s) (non-major)
|
Statistics |
|
|---|---|
| National schedule fee is underpriced – per cent |
88% |
| Seriously underpriced (under 50 per cent of costs) |
38% |
| Significantly underpriced (50-74 per cent of costs) |
27% |
| Moderately underpriced (75-99 per cent of costs) |
23% |
| About right (100 per cent of costs) |
12% |
| Overpriced (over 100 per cent of costs) |
0% |
| National fee pricing question – base |
132 |
| Total per cent underpriced – rank |
5 out of 39 |
| Seriously underpriced - rank |
7 out of 39 |
| Estimated national fee as per cent of typical costs |
64% |
| National fee as per cent of typical costs – rank |
7 out of 39 |
| Current national schedule fee(s) |
£586 |
| Estimated typical costs incurred |
£920 |
| In top three to be prioritised – number |
16 |
| In top three to be prioritised – per cent |
11% |
| In top three to be prioritised – rank |
9 out of 32 |
Table 70: Removal or variation of a condition following grant of planning permission (for example, Section 73s) (major)
|
Statistics |
|
|---|---|
| National schedule fee is underpriced – per cent |
92% |
| Seriously underpriced (under 50 per cent of costs) |
51% |
| Significantly underpriced (50-74 per cent of costs) |
27% |
| Moderately underpriced (75-99 per cent of costs) |
13% |
| About right (100 per cent of costs) |
8% |
| Overpriced (over 100 per cent of costs) |
0% |
| National fee pricing question – base |
134 |
| Total per cent underpriced – rank |
2 out of 39 |
| Seriously underpriced - rank |
2 out of 39 |
| Estimated national fee as per cent of typical costs |
57% |
| National fee as per cent of typical costs – rank |
1 out of 39 |
| Current national schedule fee(s) |
£2,000 |
| Estimated typical costs incurred |
£3,500 |
| In top three to be prioritised – number |
58 |
| In top three to be prioritised – per cent |
39% |
| In top three to be prioritised – rank |
1 out of 32 |
Table 71: Discharge of condition(s)
|
Statistics |
|
|---|---|
| National schedule fee is underpriced – per cent |
92% |
| Seriously underpriced (under 50 per cent of costs) |
38% |
| Significantly underpriced (50-74 per cent of costs) |
33% |
| Moderately underpriced (75-99 per cent of costs) |
21% |
| About right (100 per cent of costs) |
8% |
| Overpriced (over 100 per cent of costs) |
0% |
| National fee pricing question – base |
133 |
| Total per cent underpriced – rank |
1 out of 39 |
| Seriously underpriced - rank |
5 out of 39 |
| Estimated national fee as per cent of typical costs |
62% |
| National fee as per cent of typical costs – rank |
2 out of 39 |
| Current national schedule fee(s) |
£86 to £298 depending on type |
| Estimated typical costs incurred |
£140 to £480 |
| In top three to be prioritised – number |
51 |
| In top three to be prioritised – per cent |
35% |
| In top three to be prioritised – rank |
2 out of 32 |
Table 72: Reserved matters following a grant of outline planning permission
|
Statistics |
|
|---|---|
| National schedule fee is underpriced – per cent |
85% |
| Seriously underpriced (under 50 per cent of costs) |
23% |
| Significantly underpriced (50-74 per cent of costs) |
32% |
| Moderately underpriced (75-99 per cent of costs) |
31% |
| About right (100 per cent of costs) |
14% |
| Overpriced (over 100 per cent of costs) |
1% |
| National fee pricing question – base |
120 |
| Total per cent underpriced – rank |
12 out of 39 |
| Seriously underpriced - rank |
21 out of 39 |
| Estimated national fee as per cent of typical costs |
71% |
| National fee as per cent of typical costs – rank |
20 out of 39 |
| Current national schedule fee(s) |
£588 |
| Estimated typical costs incurred |
£830 |
| In top three to be prioritised – number |
11 |
| In top three to be prioritised – per cent |
7% |
| In top three to be prioritised – rank |
10 out of 32 |
Table 73: Non-material amendment following a grant of planning permission
|
Statistics |
|
|---|---|
| National schedule fee is underpriced – per cent |
74% |
| Seriously underpriced (under 50 per cent of costs) |
26% |
| Significantly underpriced (50-74 per cent of costs) |
16% |
| Moderately underpriced (75-99 per cent of costs) |
33% |
| About right (100 per cent of costs) |
26% |
| Overpriced (over 100 per cent of costs) |
0% |
| National fee pricing question – base |
129 |
| Total per cent underpriced – rank |
29 out of 39 |
| Seriously underpriced - rank |
18 out of 39 |
| Estimated national fee as per cent of typical costs |
75% |
| National fee as per cent of typical costs – rank |
28 out of 39 |
| Current national schedule fee(s) |
£44 householder applications £298 any other case |
| Estimated typical costs incurred |
£59 and £400 |
| In top three to be prioritised – number |
4 |
| In top three to be prioritised – per cent |
3% |
| In top three to be prioritised – rank |
17 out of 32 |
Table 74: Advertising
|
Statistics |
|
|---|---|
| National schedule fee is underpriced – per cent |
69% |
| Seriously underpriced (under 50 per cent of costs) |
12% |
| Significantly underpriced (50-74 per cent of costs) |
25% |
| Moderately underpriced (75-99 per cent of costs) |
32% |
| About right (100 per cent of costs) |
31% |
| Overpriced (over 100 per cent of costs) |
0% |
| National fee pricing question – base |
121 |
| Total per cent underpriced – rank |
32 out of 39 |
| Seriously underpriced - rank |
35 out of 39 |
| Estimated national fee as per cent of typical costs |
79% |
| National fee as per cent of typical costs – rank |
5 out of 39 |
| Current national schedule fee(s) |
£168 |
| Estimated typical costs incurred |
£210 |
| In top three to be prioritised – number |
0 |
| In top three to be prioritised – per cent |
0% |
| In top three to be prioritised – rank |
35 out of 32 |
Annex B: Questionnaire
Section 1: National fee schedule cost recovery
1. For each of the following planning applications, how do the fees set out in the current national fee schedule compare with the typical costs incurred in processing and deciding those applications?
In considering your response, and when thinking about cost recovery, please include in your considerations factors such as the salary costs of all staff involved, the cost of specialist input, fees paid to consultees, IT and equipment, premises and any other significant costs incurred. In the interests of time, please answer based on the best intelligence available to you - we are looking for your best estimations and recognise that your responses will be based on a combination of professional judgement, practical/professional experience, and varying levels of supporting evidence.
The following categories are based on the national fee schedule published by the Planning Portal, a number of which were recently updated in April 2025.
Response options:
- The national fee is overpriced - it exceeds the typical cost incurred.
- The national fee is about right - it reflects the typical cost incurred.
- The national fee is moderately underpriced - it covers between 75-99 per cent of the typical cost incurred.
- The national fee is significantly underpriced - it covers between 50-74 per cent of the typical cost incurred.
- The national fee is seriously underpriced - it covers less than 50 per cent of the typical cost incurred.
- Don't know.
Application types:
- householder applications
- outline applications (non-major)
- outline applications (major)
- permission in principle (4)
- full applications and first submissions of reserved matters, or technical details consent
- enlargement or alterations to existing dwellings
- erection of dwellings (non-major - fewer than 10 units)
- erection of dwellings (medium/major - 10-50 units)
- erection of dwellings (major - more than 50 units)
- erection of non-dwelling buildings (non-major)
- erection of non-dwelling buildings (major)
- erection of buildings on agricultural land (non-major)
- erection of buildings on agricultural land (major)
- erection/alterations/replacement of plant and machinery
- car parks, service roads, other access.
- operations drilling for oil or natural gas (not more than 7.5 hectares)
- operations drilling for oil or natural gas (over 7.5 hectares)
- operations other than drilling for, winning and working of oil or natural gas (not more than 15 hectares)
- operations other than drilling for, winning or working of oil or natural gas (over 15 hectares)
- other operations for the winning and working of minerals (not more than 15 hectares)
- other operations for the winning and working of minerals (over 15 hectares)
- change of use of building to use as dwellinghouse (fewer than 10 units)
- change of use of building to use as dwellinghouse (medium/major - 10-50 units)
- change of use of building to use as dwellinghouse (major - more than 50 units)
- other change of use of a building or land
- waste (not more than 15 hectares)
- waste (more than 15 hectares)
- lawful development certificate(s) (existing use)
- lawful development certificate(s) (proposed use)
- prior approval (under the permitted development rights listed)
- prior approval (upward extensions to create new dwelling houses - fewer than 10 units)
- prior approval (upward extensions to create new dwelling houses - 10-50 units)
- prior approval (upward extensions to create new dwelling houses - more than 50 units)
- removal or variation of a condition following grant of planning permission (for example, Section 73s) (householder)
- removal or variation of a condition following grant of planning permission (for example, Section 73s) (non-major)
- removal or variation of a condition following grant of planning permission (for example, Section 73s) (major)
- discharge of condition(s)
- reserved matters following a grant of outline planning permission
- non-material amendment following a grant of planning permission
- advertising.
2. If the government were to review specific nationally set fees, which of the following application types do you think should be prioritised to better reflect full cost recovery?
Please choose up to three of the application types below. If fewer than three application types are visible, please select up to the maximum number shown. Any application types respondents identified as moderately, significantly or seriously underpriced were offered to them as options for this question.
3. Aside from levels of fees, what else, if anything, would you say needs to be added (for example, are there '£0 fee' applications that could/should be charged for), removed or improved in the national fee schedule?
For example, are some application categories too variable and in need of disaggregation to charge fairer fees?
- Suggested additions to the national fee schedule
- Suggested removals from the national fee schedule
- Other suggested improvements to the national fee schedule
Section 2: Costs and hourly rates – discretionary fees
4. Does your council currently charge for pre-application advice?
This question excludes Planning Performance Agreements (PPAs), which are covered in a separate question.
- Yes, for all applications
- Yes, for some applications
- No, we do not charge for pre-application advice
5. [Shown to respondents who answered ‘Yes’ to Question 4.] What was your council's annual income from pre-application fees for the 2024/25 financial year?
Please enter the full income from these fees in units of GBP, without commas or currency signs, rounded to the nearest thousand. This figure can be an estimate rather than an exact amount, if necessary. Please enter only numbers into the box below. For example, fifty thousand pounds should be expressed as 50000, not 50, 50k, £50k, 40-60k, etc. If you cannot disaggregate pre-application fees from PPA fees, please provide a rough estimation of the amount of income in GBP relating to pre-application fees that is likely to have accrued to your council in this time. If you are unable to provide this data, please leave the box blank.
6. What factors are included when your council's pre-application fees are calculated?
Please select all that apply.
- Officer salaries (including pensions, national insurance, training, sick leave etc)
- Specialist input and consultation (for example, heritage, ecology etc)
- Corporate overheads (for example, building costs, equipment, IT and support services)
- Other (please specify)
7. Are your council's pre-application fees based on an officer hourly rate (for example, a fixed fee derived from an hourly rate multiplied by the time spent)?
- Yes
- No
- Don’t know
8. [Shown to respondents who answered ‘Yes’ to Question 7.] What hourly rate does your council currently use to calculate its pre-application fee?
Please provide the approximate total cost per hour, including all officers' input along with general overheads, if applicable, rounded to the nearest pound. Please do not include VAT. Please enter only numbers into the box below. If your council's hourly rate is a range (either based on the input of different staff or specialisms or a range depending on application type or size), please enter the midpoint of the range. For example, one hundred and fifty pounds should be expressed as 150, not £150, £140-160, etc. If you are unable to provide this data, please leave the box blank.
9. [Shown to respondents who answered ‘No’ to Question 7.] On what basis does your council calculate its pre-application fees?
Please select all that apply.
- Using the PAS pre-application fee calculator tool
- Recording time input by council staff
- Benchmarking with other councils
- Benchmarking against the council's historic fee rates
- Negotiation between the applicant and the council on an individual basis
- Other (please specify)
- Don't know
10. Does your council currently enter into charged-for planning performance agreements (PPAs) with developers for local planning applications?
This does not include nationally significant infrastructure projects (NSIPs), which are covered in a separate question.
- Yes
- No
- Don’t know
11. [Shown to respondents who answered ‘Yes’ to Question 10]. What was your council's annual income from PPA charges for the 2024/25 financial year?
Please enter the full income from these fees in units of GBP, without commas or currency signs, rounded to the nearest thousand. This figure can be an estimate rather than an exact amount, if necessary. Please enter only numbers into the box below. For example, fifty thousand pounds should be expressed as 50000, not 50, 50k, £50k, 40-60k, etc. If you cannot disaggregate pre-application fees from PPA fees, please provide a rough estimation of the amount of income in GBP relating to PPA fees excluding any pre-application fees that is likely to have accrued to your council in this time. If you are unable to provide this data, please leave the box blank.
12. [Shown to respondents who answered ‘Yes’ to Question 10]. What factors are included when your council's PPA charges are calculated?
Please select all that apply.
- Officer salaries (including pensions, national insurance, training, sick leave etc)
- Specialist input and consultation (for example, heritage, ecology etc)
- Corporate overheads (for example, building costs, equipment, IT and support services)
- Other (please specify)
13. [Shown to respondents who answered ‘Yes’ to Question 10]. Are your council's PPA fees based on an officer hourly rate (for example, a fixed fee derived from an hourly rate multiplied by the time spent)?
- Yes
- No
- Don’t know
14. [Shown to respondents who answered ‘Yes’ to Question 13]. Is your council's current hourly rate for PPA fees the same as the hourly rate for pre-application fees provided above?
- Yes
- No
- Don’t know
15. [Shown to respondents who answered ‘Yes’ to Question 14.] What hourly rate does your council currently use to calculate its PPA fee?
Please provide the approximate total cost per hour, including all officers' input along with general overheads, if applicable, rounded to the nearest pound. Please do not include VAT. Please enter only numbers into the box below. If your council's hourly rate is a range (either based on the input of different staff or specialisms or a range depending on application type or size), please enter the midpoint of the range. For example, one hundred and fifty pounds should be expressed as 150, not £150, £140-160, etc. If you are unable to provide this data, please leave the box blank.
16. [Shown to respondents who answered ‘Yes’ to Question 13.] On what basis does your council calculate its PPA fees?
Please select all that apply.
- Using the PAS pre-application fee calculator tool
- Recording time input by council staff
- Benchmarking with other councils
- Benchmarking against the council's historic fee rates
- Negotiation between the applicant and the council on an individual basis
- Other (please specify)
- Don't know
Section 3: Statutory planning application fees
17. Has your council carried out any work to calculate the actual cost of processing and deciding planning applications?
For example, working out staff input and other costs, and/or recording length of time spent on processing and deciding different applications. This question excludes nationally significant infrastructure projects (NSIPs), which are covered in a separate question.
- Yes - for all planning application types
- Yes - for certain planning application types (for example, householder, major residential)
- No, but we are planning to
- No, and we have no current plans to
- Don't know
18. [Shown to respondents who answered ‘Yes’ to Question 17.] Has your council established an hourly rate, or range of rates, for planning application fees?
- Yes
- No
- Don’t know
19. [Shown to respondents who answered ‘Yes’ to Question 18.] Is your council's current hourly rate for planning application fees the same as the hourly rate for pre-application fees provided above?
- Yes
- No
- Don’t know
20. [Shown to respondents who answered ‘No’ to Question 19.] What is your council's current hourly rate for planning application fees?
Please provide the approximate total cost per hour, including all officers' input along with general overheads, if applicable, rounded to the nearest pound. Please do not include VAT. Please enter only numbers into the box below. If your council's hourly rate is a range (either based on the input of different staff or specialisms or a range depending on application type or size), please enter the midpoint of the range. For example, one hundred and fifty pounds should be expressed as 150, not £150, £140-160, etc. If you are unable to provide this data, please leave the box blank.
21. [Shown to respondents who answered ‘Yes’ to Question 18.] What factors are included when calculating your council's hourly rate for planning application fees?
Please select all that apply. This excludes fees for nationally significant infrastructure projects (NSIPs), which are covered separately later in the survey.
- Officer salaries (including pensions, national insurance, training, sick leave etc)
- Specialist input and consultation (for example, heritage, ecology etc)
- Corporate overheads ( for example, building costs, equipment, IT and support services)
- Other (please specify)
22. [Shown to respondents who answered ‘Yes’ to Question 17.] Would you be willing to share your data and calculations for your council's planning application costs with the Planning Advisory Service (PAS), in confidence?
If you answer "yes" below, PAS will email you to request the data and calculations.
- Yes
- No
Section 4: Cost recovery for Nationally Significant Infrastructure Projects (NSIPs)
23. Since the 2020/21 financial year, has your council entered into any charged-for planning performance agreements (PPAs) with developers or project promoters for Nationally Significant Infrastructure Projects (NSIPs)?
- Yes
- No
- Don’t know
24. [Shown to respondents who answered ‘Yes’ to Question 23.] What proportion of the costs related to NSIPs incurred by your council can usually be recovered?
Please consider all stages of the NSIP process, from pre-application to implementation.
- All costs (100%)
- A large majority of costs (75-99%)
- A majority of costs (50-74%)
- A significant minority of costs (25-49%)
- None or a small minority of costs (0-24%)
- Don't know
25. [Shown to respondents who answered ‘Yes’ to Question 23.] In your council's experience, how long does it usually take to negotiate and agree a PPA with an NSIP promoter or developer?
Please estimate the usual time taken from initial contact to signing a PPA, for NSIPs where a PPA is successfully agreed.
- Less than 3 months
- Between 3 months and under 6 months
- Between 6 months and under 12 months
- 12 months or more
- Don't know
26. [Shown to respondents who answered ‘Yes’ to Question 23.] In your experience, how easy or difficult is it to recover the costs for work done at each of the following stages of the NSIP process?
Response options:
- Very easy
- Fairly easy
- Fairy difficult
- Very difficult
- Don’t know
NSIP process stages:
- Pre-application
- Acceptance
- Pre-examination
- Examination
- Post-consent
27. [Shown to respondents who answered ‘Yes’ to Question 23.] What support, if any, does your council usually provide within a PPA for NSIPs?
Please select all that apply.
- Planning officer or case officer
- Technical team or support team
- Professional expertise from other professions (for example, Highways, Archaeology, Ecology, Flood Risk, Environmental Health, etc.), including any expertise secured externally
- Legal advice at the pre-application and pre-examination stages
- Legal advice and representation at the examination stage (whether externally or internally provided)
- Internal governance and engagement (for example, committee reports, member briefings, etc.)
- External communication or engagement (for example, work with parish and town councils, public meetings, etc.)
- Discharge of requirements and other post-consent activity
- Senior officer leadership
- Other (please specify)
- None of the above
- Don't know
28. [Shown to respondents who answered ‘Yes’ to Question 23.] On which factors are your council's NSIP PPA charges usually calculated?
Please select all that apply.
- Officer salaries (including pensions, national insurance, training, sick leave etc)
- Specialist input and consultation (for example, heritage, ecology etc)
- Corporate overheads (for example, building costs, equipment, IT and support services)
- External professional input (for example, consultants) or externally commissioned evidence (for example, externally commissioned local impact report, etc)
- Other (please specify)
29. [Shown to respondents who answered ‘Yes’ to Question 23.] Are your council's NSIP PPA fees largely based on an hourly rate?
- Yes
- No
- Don’t know
30. [Shown to respondents who answered ‘Yes’ to Question 29.] What hourly rate does your council currently use to calculate its charge / fee for NSIPs?
Please provide the approximate total cost per hour, including all officers' input along with general overheads, rounded to the nearest pound. Please do not include VAT. Please enter only numbers into the box below. If your council's hourly rate is a range (either based on the input of different staff or specialisms or a range depending on application type or size), please enter the midpoint of the range. For example, one hundred and fifty pounds should be expressed as 150, not £150, £140-160, etc. If you are unable to provide this data, please leave the box blank.
31. [Shown to respondents who answered ‘Yes’ to Question 23.] Does your council consistently record the amount of time spent by council officers on NSIP-related work, for example, using timesheets?
- Yes
- No
- Don’t know
32. [Shown to respondents who answered ‘Yes’ to Question 31.] Does your council report the amount of time spent on NSIPs in order to determine the costs chargeable by the council?
- Yes
- No
- Don’t know
33. [Shown to respondents who answered ‘Yes’ to Question 23.] What is the payment schedule that determines your council receiving payments for its work on NSIPs?
- Payments against an activity report on a quarterly or other agreed regular basis
- Payments on meeting agreed milestones or trigger points
- Other (please specify)
- Don't know
34. [Shown to respondents who answered ‘Yes’ to Question 23.] Would you be willing to share more information about how you calculate costs for NSIPs with the Planning Advisory Service, on a confidential basis?
If you answer 'yes' below, PAS will email you to discuss this further.
- Yes
- No
35. Do you have anything else that you would like to share about PPAs and cost recovery for NSIPs specifically?
A further question for any other comments on other aspects of planning fees and cost recovery will be made available at the end of the survey.
Section 5: Appetite and priorities for localised fee setting
36. Would your council set its own localised planning application fees, if legislation allowed it?
- Yes - we would set our own fees
- Possibly - we may or may not set our own fees
- No - we would not set our own fees
- Don't know
37. What, if anything, do you see as the biggest challenges with localised fee setting?
- The resources required to establish evidence on costs and time spent
- Inconsistencies resulting from variations in fees between councils
- The relationship between application fees and other discretionary fees
- The effect localised fees may have on discretionary fee income
- Investment being discouraged by higher fees
- Other (please specify)
- None of the above - no challenges foreseen
- Don't know
38. Would you be willing to help test or co-design a localised fee-setting model? If you answer 'yes' or 'possibly' below, PAS will email you to discuss this further.
- Yes
- No
- Don’t know