Executive summary
The 2025 Health Check survey received 15,855 responses from 137 different organisations, showing a 3.5 per cent increase in responses from last year.
This report outlines the key findings from occupational therapists (a separate report on the experience of registered social workers and non-registered social care professionals can be found on the LGA website). A full report of the findings at a national and regional level is available on the Knowledge Hub site. This summary compares the standards with the previous year’s survey (2023/24) and summarises some key findings that have emerged from the responses of OTs:
- the overall national average across all OT standards is good at 77 – up slightly from 75 in 2024.
- there was more significant change in the regional responses: most noticeably, the average response in Yorkshire & Humber increased from 71 in 2024 to 78 in 2025.
- North East (81) and London (80) had the highest average responses.
- supervision (standard 5) and professional registration (standard 7 ) continue to be the best performing standards (84 and 85 respectively).
- effective workforce planning systems (standard 2) continues to be the lowest performing standard (70).
Introduction
Occupational therapists play an essential role in helping people to carry out everyday activities in work and leisure. In England, over 21,000 occupational therapists are employed by the NHS, while 3,400 OTs work in local authorities (according to September 2024 research by Skills for Care).
The standards for employers of occupational therapists were established in 2022. These standards set out core expectations of employers to enable OTs to work effectively and safely.
The Health Check survey helps organisations who employ OTs to understand some critical questions about their workplace experiences:
- How well do employers deliver the employer standards?
- How well do employees perceive their working environment?
Please note that this summary report relies on data collected from occupational therapists employed by local authorities and related agencies. While the results are considered to represent a reasonable national sample, no claims are made for generalisation of the results to other areas of the UK.
The Employer Standards
Full description of the 8 standards for employers of occupational therapists is available on the LGA website. The standards touch on a range of key themes for the workforce, from skills and professional development to wellbeing:
Standard 1 – Strong and clear occupational therapy framework
This standard is a clear statement on the principles that constitute good occupational therapy practice, and how those principles function across the full range of settings. It outlines the ways in which each organisation can achieve and maintain the theories, skills, research, and evidence that underpin good occupational therapy practice at strategic and operational levels.
Standard 2 – Effective workforce planning systems
This standard is about using effective workforce planning systems to make sure that the right number of occupational therapists, with the right level of skills and experience, are available to meet current and future service demands.
Standard 3 – Safe occupational therapy workloads and case allocation
This standard is about ensuring employees do not experience excessive workloads, resulting in unallocated cases and long waiting times for the people accessing the service.
Standard 4 – Wellbeing
This standard is about promoting a positive culture for employee wellbeing and supporting occupational therapists to have the practical tools, resources, and organisational environment they need to practice safely.
Standard 5 – Supervision
This standard is about making sure occupational therapy students and qualified occupational therapy practitioners can reflect critically on their practice through high-quality, regular supervision as an integral part of occupational therapy practice.
Standard 6 – Continuing Professional Development (CPD)
This standard is about occupational therapists being provided with the time and opportunity to learn, keep their knowledge and skills up to date, and critically reflect on the impact this has on their occupational therapy practice.
Standard 7 – Professional registration
This standard is about supporting an occupational therapist to maintain their professional registration with their regulating body so that they can continue to practice as an occupational therapist.
Standard 8 – Strategic partnerships
This standard is about creating strong partnerships, system leadership and encouraging collaboration between employers, ICS stakeholders, Higher Education Institutions, training providers, and promoting the degree apprenticeship for occupational therapy workforce development.
Participants
The survey was carried out from early January to mid-February 2025. It received a total of 15,885 responses and of these 1,688 were from occupational therapists, making up 11 per cent of the participants.
Figure 1: Breakdown of survey responses by occupation
| 2025 | Percentage | 2024 | Percentage change | |
| Registered Social Workers | 6,961 | 44% | 7,068 | -1.5% |
| Social Care Workers | 7,206 | 45% | 6,351 | +13.5% |
| Occupational Therapists | 1,688 | 11% | 1,902 | -11.3% |
| Total | 15,855 | 15,321 | +3.5% |
Based on feedback from previous Health Check surveys, this year we have included a more in-depth breakdown between adults, children’s and integrated service areas to capture a more comprehensive understanding of the perceptions of the employer standards from different groups.
| 2025 | Percentage | 2024 | Percentage change | |
| Adults | 1,319 | ~78% | 1,443 | -9% |
| Children | 90 | ~5% | 105 | -14% |
| Integrated Adults and Children | 199 | ~12% | 220 | -10% |
| Other | 80 | ~5 | 26 | +207% |
| Total | 1,688 | 1,902 |
Methodology
The data from the survey was interpreted using a mean average score for each question as the survey aimed to measure attitudes and opinions on a quantifiable scale. Respondents were asked to select options from a Likert scale ranging from ‘strongly disagree’ to ‘strongly agree’. The mean score is used to determine the average performance of a question so it can also be referred to as the average satisfaction score. This score can be converted to the same number as a percentage to indicate the average percentage of the score relative to the maximum score.
Scores or percentages for a question between 0-50 indicate a low outcome, scores between 51-74 indicate a moderate outcome, and scores between 75-100 indicate a good outcome. This is the same scale as last year to allow for meaningful comparisons to be made across time.
The results at a glance
This table presents the overall differences in the responses from 2024 to 2025 and the change in percentage points:
| Employer Standard | Average Mean Score 2025 | Average Mean Score 2024 | Change |
|---|---|---|---|
| Standard 1: Strong and Clear Occupational Therapy Framework | 82 | 80 | +2 |
| Standard 2: Effective Workforce Planning Systems | 70 | 68 | +2 |
| Standard 3: Safe Workloads and Case Allocation | 75 | 73 | +2 |
| Standard 4: Wellbeing | 82 | 80 | +2 |
| Standard 5: Supervision | 84 | 82 | +2 |
| Standard 6: Continuing Professional Development (CPD) | 73 | 71 | +2 |
| Standard 7: Professional Registration | 85 | 84 | +1 |
| Standard 8: Strategic Partnerships | 74 | 73 | +1 |
| Overall engagement with my job and my organisation | 74 | 75 | +1 |
This table presents the breakdown of results across adults, children’s and integrated services. While there is some marginal difference in the performance of the individual standards, the overall average came out at 78 across adults, children and integrated. This indicates that the standards are upheld to a good level by employers across all OT service areas.
| Employer Standard | Adults | Children | Integrated Adults and Children | Other |
|---|---|---|---|---|
| Overall average | 78 | 78 | 78 | 75 |
| Standard 1: Strong and Clear Occupational Therapy Framework | 82 | 81 | 82 | 78 |
| Standard 2: Effective Workforce Planning Systems | 69 | 68 | 72 | 70 |
| Standard 3: Safe Workloads and Case Allocation | 75 | 78 | 75 | 74 |
| Standard 4: Wellbeing | 82 | 83 | 83 | 80 |
| Standard 5: Supervision | 84 | 87 | 83 | 84 |
| Standard 6: Continuing Professional Development (CPD) | 74 | 74 | 75 | 67 |
| Standard 7: Professional Registration | 84 | 85 | 87 | 79 |
| Standard 8: Strategic Partnerships | 75 | 70 | 75 | 73 |
| Overall engagement with my job and my organisation | 75 | 73 | 74 | 70 |
The Standards overall
How well do employers deliver the employer standards for occupational therapists?
It is positive to see that the overall national average across OT responses has increased by one percentage point from 77 in 2024 to 78 in 2025. This increase is consistent across all service areas.
Supervision (standard 5) and professional registration (standard 7) continue to be the best performing standards (84 and 85 respectively). The frequency and quality of supervision is fundamental to facilitating safe and effective occupational therapy practice. Relatedly, the professional registration standard ensures that employers support their workforce in their registration with the regulator – this includes maintaining their registration, as well as understanding the process for misconduct investigation.
Meanwhile, effective workforce planning systems (standard 2) continues to be the lowest performing standard, with a moderate score of 70. This highlights that employers should do more to ensure that both immediate and future staffing requirements are being met. OTs reported that they were not being consulted on the workforce changes within their organisation. Employee consultation is an important part of workforce planning to understand internal needs and demands, as well as boost staff morale and wellbeing more generally.
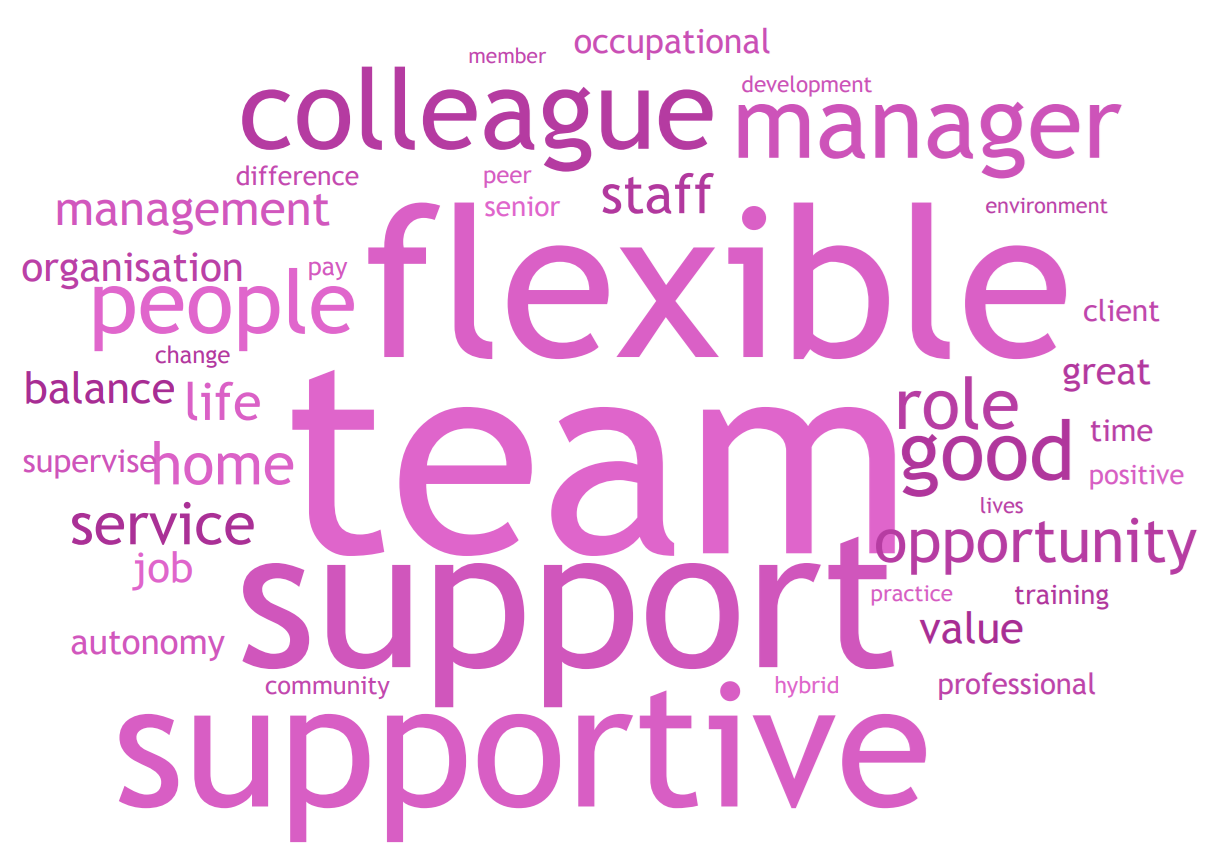
Word clouds
As well as asking quantitative questions, we included some qualitative free-text questions to further understand occupational therapists’ perspectives. The word clouds below illustrate the most common responses we received to the questions. The frequency of the words is demonstrated by how large or small the word appears to be, with larger words indicating greater frequency.
What is the best thing about working for your organisation?
OTs cited flexibility and their supportive team and colleagues as the best parts of working for their organisation.
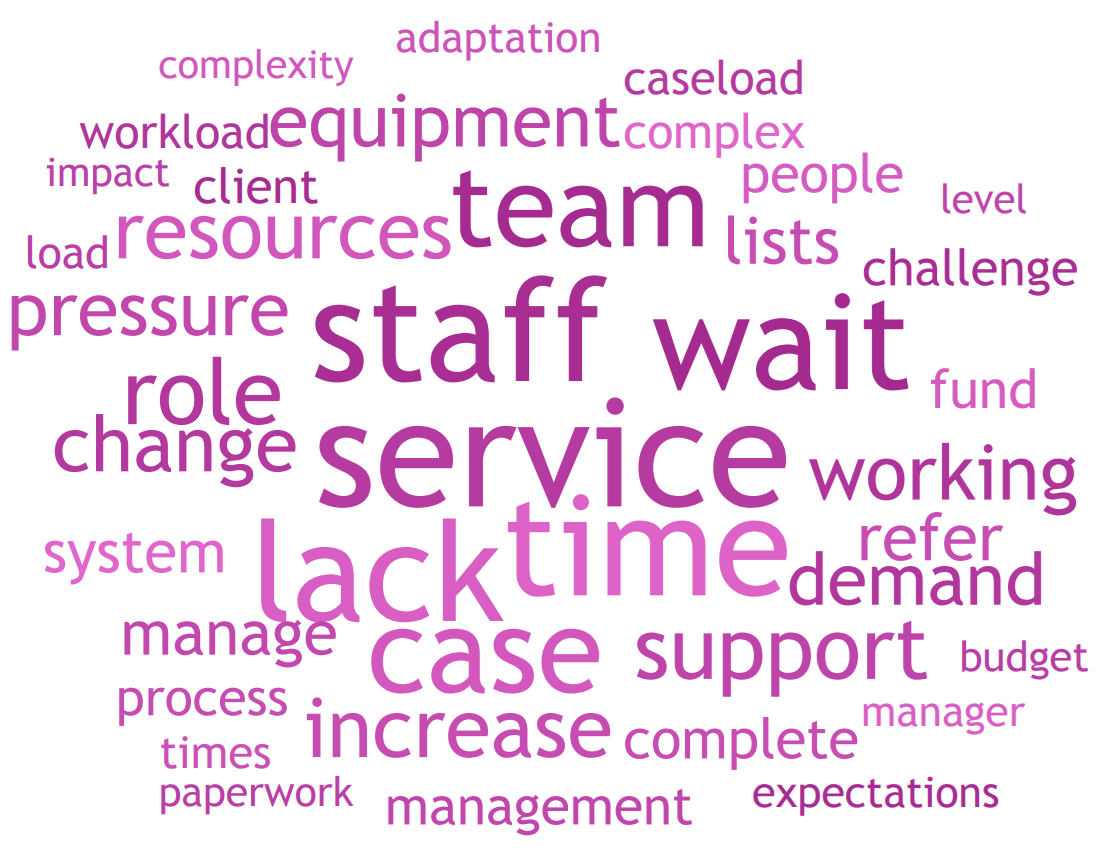
What is the biggest challenge you are currently facing at work?
When asked what the biggest challenges at work were, OTs described the pressure of increased service demand and caseload with a lack of time and resources.
Regional differences
There was more significant change in the regional responses: most noticeably, the average response in Yorkshire & Humber increased from 71 in 2024 to 78 in 2025. This is an impressive improvement, driven by a particularly high score in children’s occupational therapy services (81).
The North East (81) and London (80) had the highest average responses overall. It is positive to see that the lowest performing region (East Midlands - 74) is making steady improvement with an average increase of one percentage point across the standards since last year.
Figure 3: Overall regional comparisons from 2024-2025
| 2024 | 2025 | |
| National | 77 | 78 |
| East Midlands | 73 | 74 |
| East of England | 78 | 77 |
| London | 76 | 80 |
| North East | 80 | 81 |
| North West | 78 | 77 |
| South East | 78 | 80 |
| South West | 78 | 79 |
| West Midlands | 78 | 75 |
| Yorkshire & Humber | 71 | 78 |
Figure 4: Adults services regional comparisons from 2024-2025
| 2024 | 2025 | |
| National | 76 | 78 |
| East Midlands | 70 | 73 |
| East of England | 77 | 77 |
| London | 76 | 81 |
| North East | 79 | 80 |
| North West | 79 | 76 |
| South East | 78 | 81 |
| South West | 77 | 79 |
| West Mids | 77 | 74 |
| Yorkshire & Humber | 72 | 78 |
Figure 5: Children’s services regional comparisons from 2024-2025
| 2024 | 2025 | |
| National | 78 | 79 |
| East of England | 85 | 83 |
| London | 81 | 77 |
| North West | 67 | 76 |
| South East | 75 | 76 |
| South West | 82 | 82 |
| Yorkshire & Humber | 68 | 81 |
Conclusion
The standards for employers of occupational therapists are key to guiding organisations in creating the best possible work environment, ensuring OTs can work safely, effectively, and with support for their wellbeing. In turn, this means better outcomes for individuals receiving occupational therapy.
The results of the 2025 Health Check show that, across England, employers are generally doing a good job in delivering the standards. Supervision (standard 5) and professional registration (standard 7) are identified as particular strengths across the sector. It is positive to see such commitment to maintaining a high standard of skills and delivery in the profession.
Of course, there remains room for improvement: effective workforce planning systems (standard 2) continues to be the lowest performing standard. This is becoming increasingly critical in a context of rising demand and pressures on the profession. Organisations must take care to adequately resource, for now and the future.
The Health Check results clearly show that occupational therapy teams are skilled, passionate and supportive. We encourage employers to use their survey results to create an action plan, targeting the key areas for improvement in their organisation, and building on their existing strengths. In doing so, employers can create even better workplaces and OTs can continue to do their job with excellence – supporting people to live with independence.