Employer Link has collected pay data from academy trusts (ATs) across England, all of which are members of the National Heads of HR network. This information serves as a useful tool for ATs to benchmark their pay against similar roles across England.
Employer Link has collected pay data from academy trusts (ATs) across England, all of which are members of the National Heads of HR network. We asked for data on 200 job titles that exist in the central team of the AT, ranging from CEO to Apprentice.
We have analysed the data and produced a breakdown showing the pay range for staff across regions, trust sizes and job family – from finance, to HR, to school improvement.
This information serves as a useful tool for ATs to benchmark their pay against similar roles across England. Benchmarking is key to ensuring fair and competitive pay – in turn, attracting and retaining a skilled workforce.
The below summary outlines some key findings, and provides examples of how ATs could use the data to support fair pay in their organisation.
To find out about the full data set on offer for Employer Link subscribers, please contact [email protected]. New Employer Link subscribers will also be able to join the Heads of HR Network, gaining access to support across the sector.
How could I use this salary information in my organisation to ensure we pay fairly?
Example 1: Benchmarking job roles against similar neighbours (region and size)
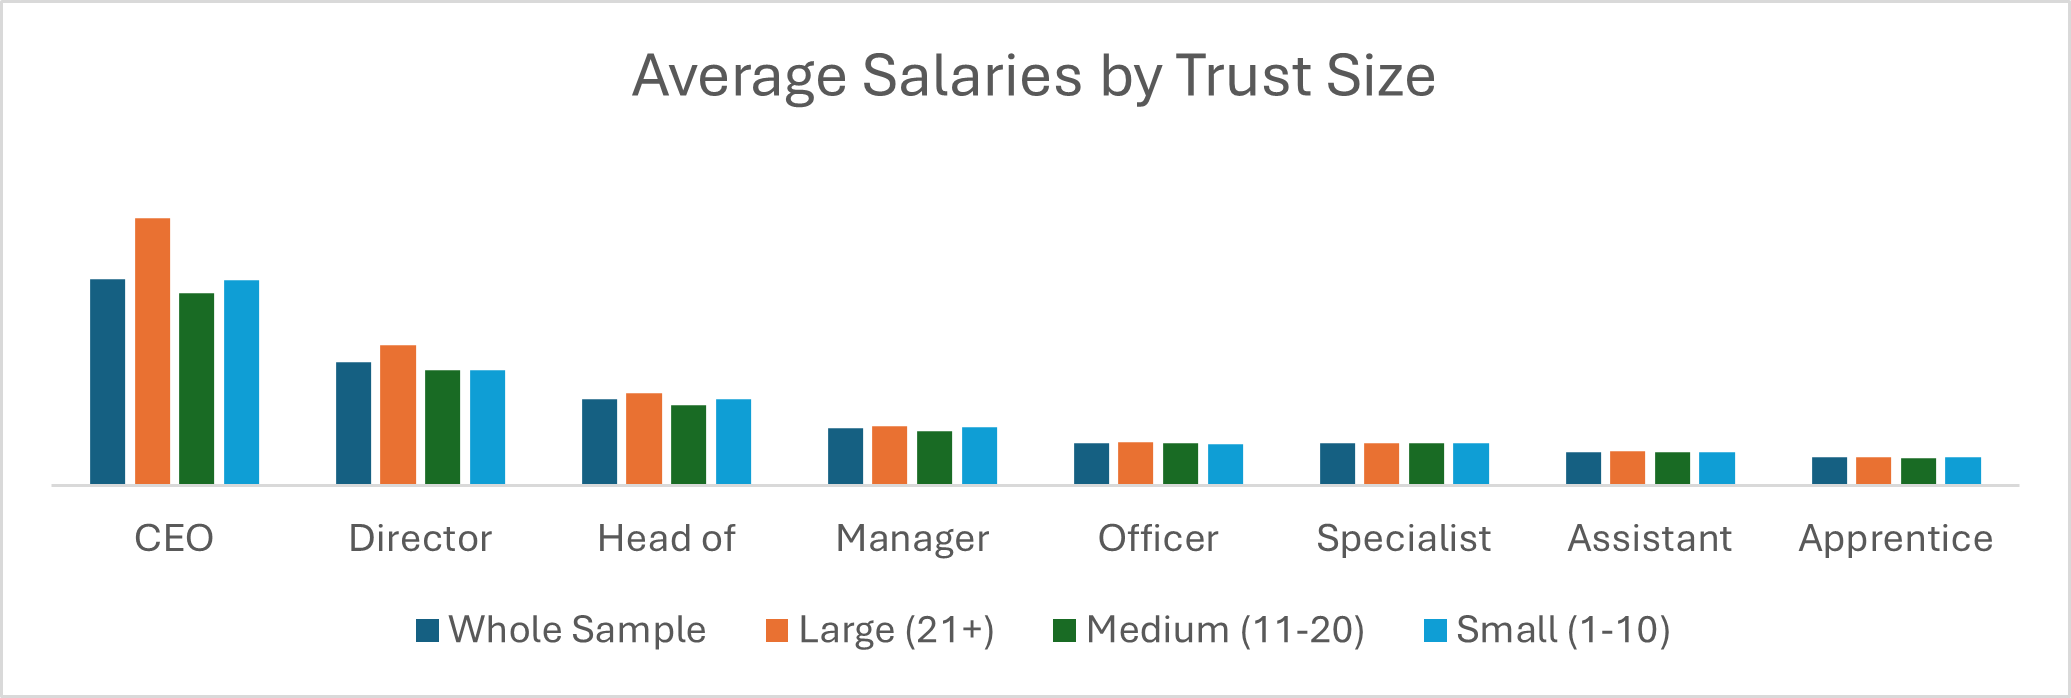
It is clear that the average salary for a job role differs considerably based on the size of the AT, and where in the country it is located. Our data analysis has grouped pay by region and trust size to create meaningful comparisons against similar organisations.
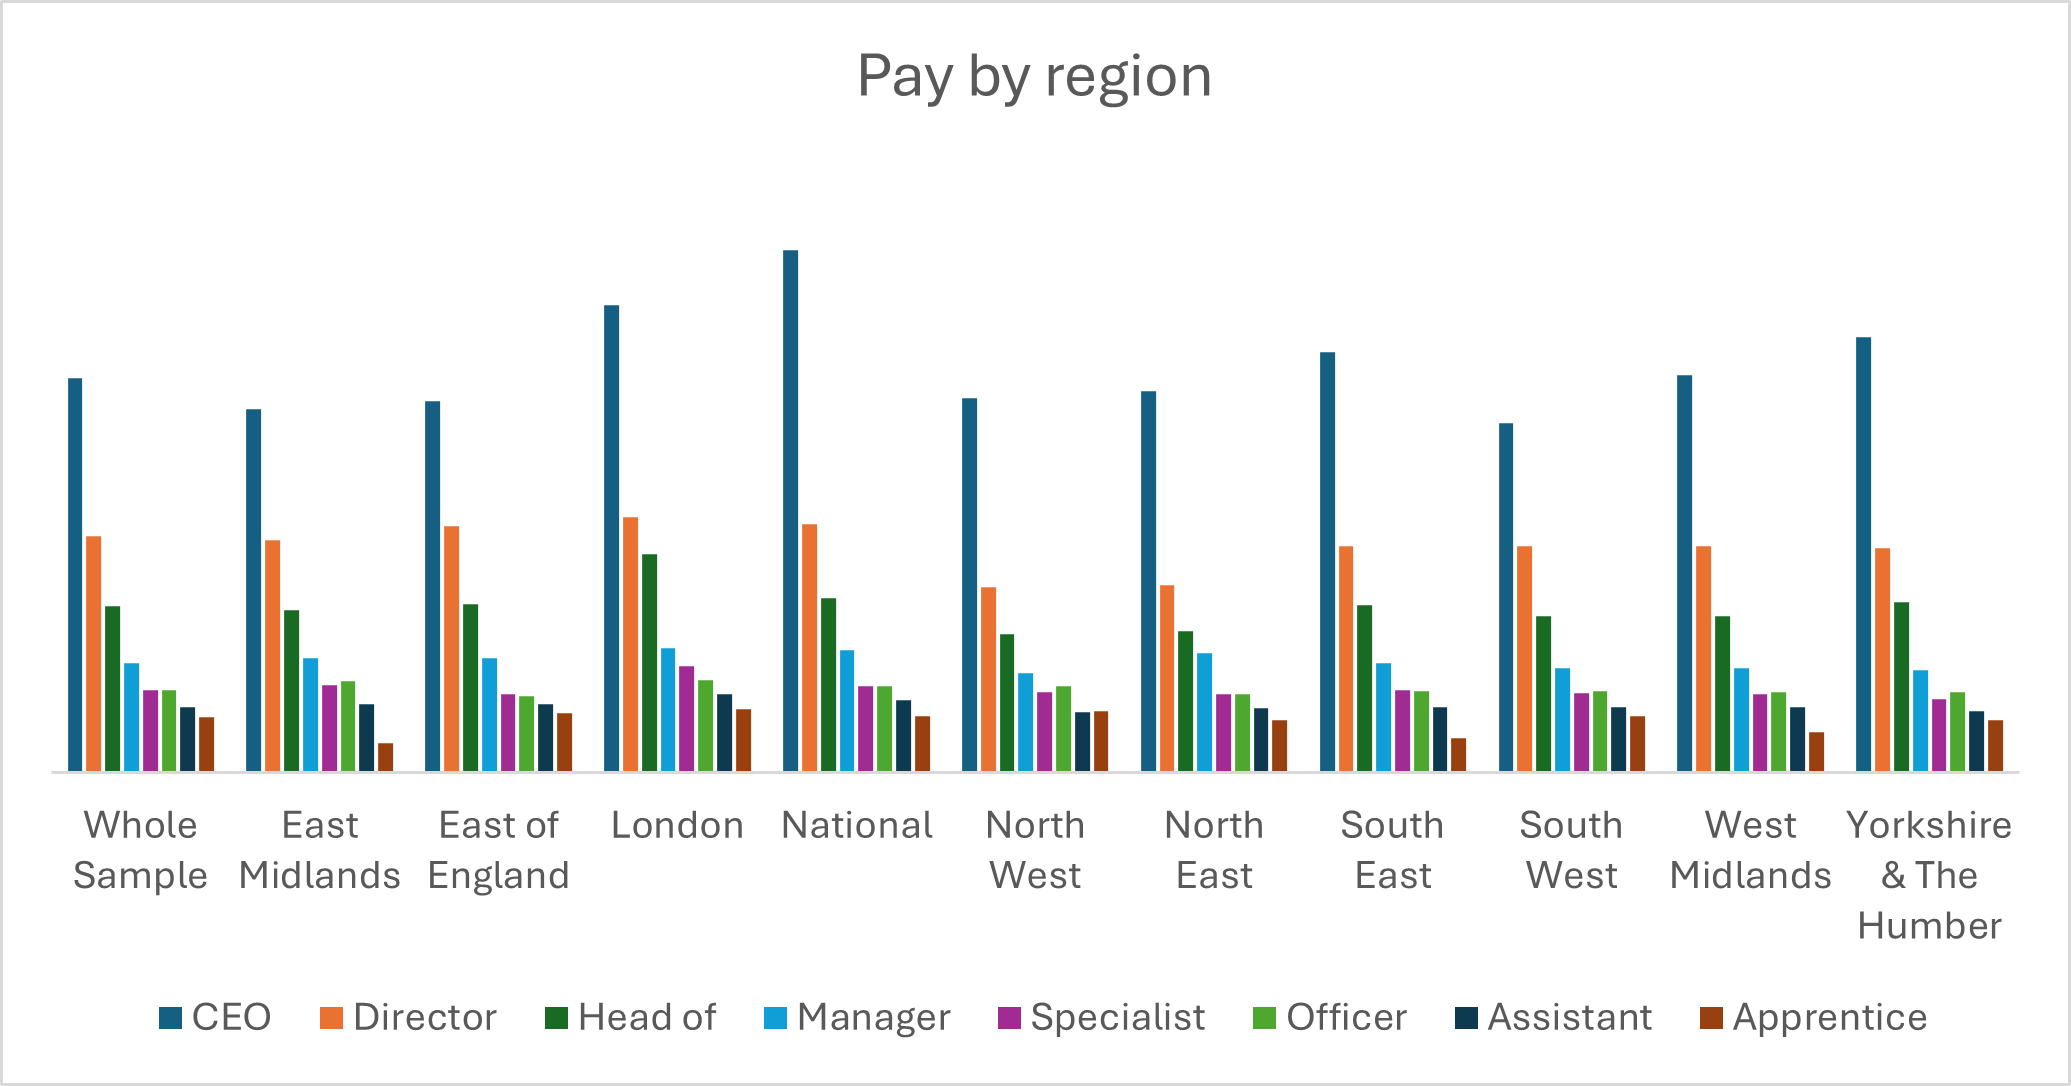
Case study: CEO in five-academy AT in the north east
For example, our analysis shows that smaller trusts and those in the North East are paid below median rates. We can provide quartile figures, so that a five-academy MAT in the north east looking to review their CEO salary can make an informed value judgement, backed up by clear benchmarking against organisations in similar contexts.
Example 2: Comparing job roles across job families (e.g. finance, HR, T&L)
While a job role may be similar by title and tier (e.g. Head of), our data explores the variation in salaries across different job families and service areas. This can be useful for evidencing why some roles are paid more than others with similar titles – benchmarking shows that the function and department does make a difference in most ATs.
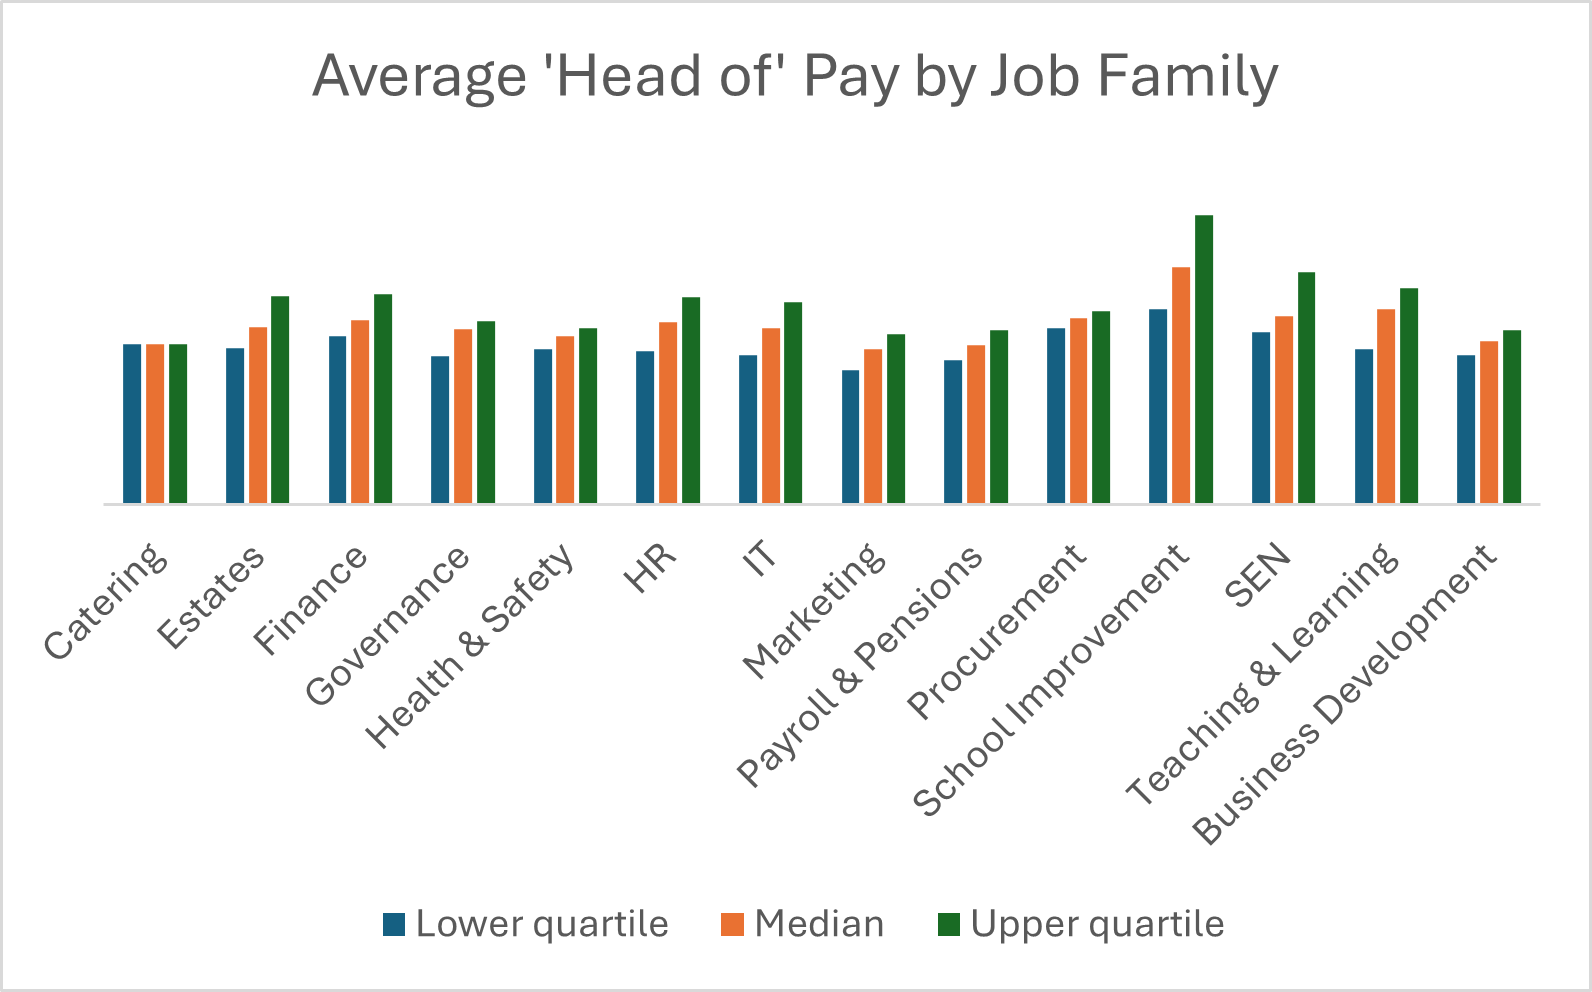
Case study: Head of Finance versus Head of School Improvement
For example, our data shows significant difference between the average salary of a Head of Finance versus a Head of School Improvement. ATs can use the quartile data to make a judgement based on the skillset and experience they are looking for in each job family.
Example 3: Comparing pay ratios in an organisation
Our data analysis also demonstrates the average variation in pay across a whole organisation, with a breakdown of salaries as a proportion of the CEO’s pay. ATs can use this data to set salaries across the organisation relative to the highest paid position.
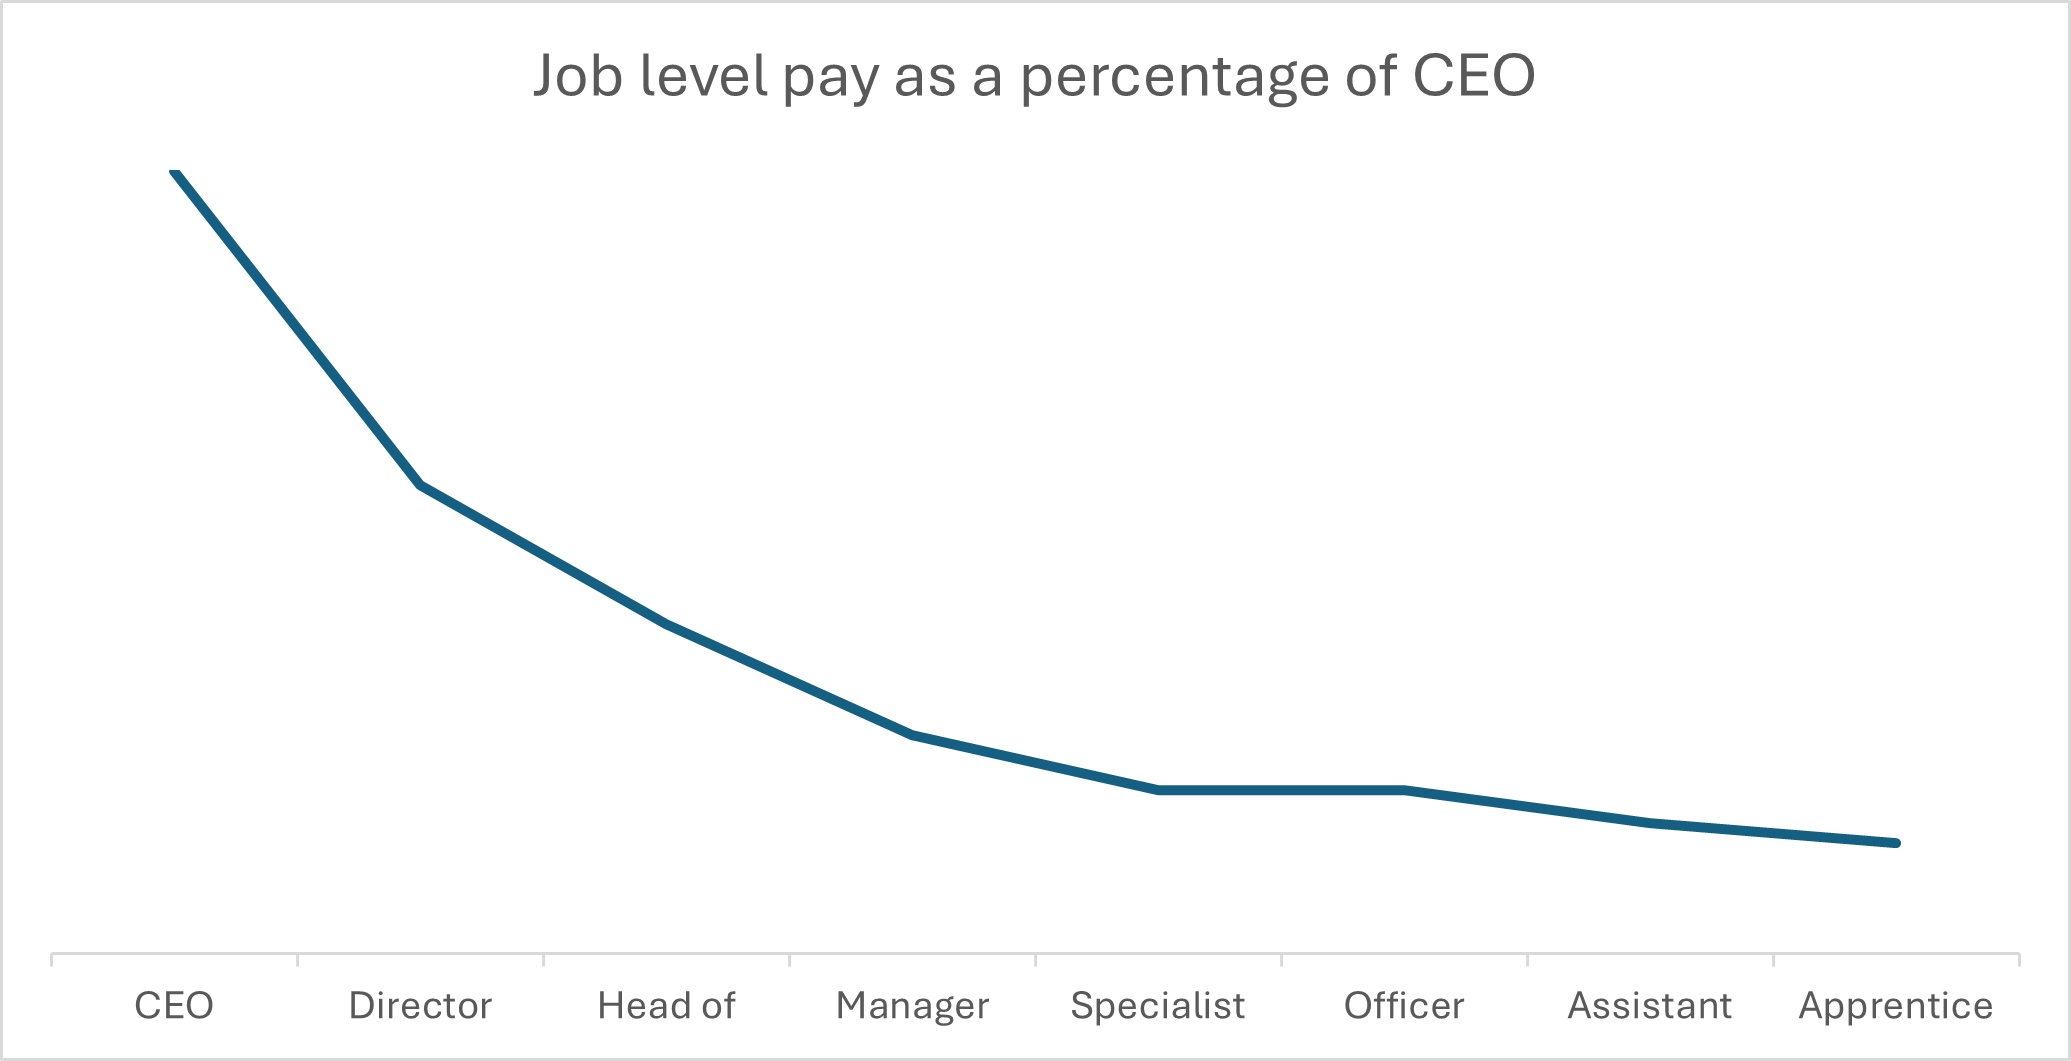
Case study: Ensuring fair pay rises
The ratio data could be useful for an AT which is looking to award some pay increases. By comparing average salaries against the CEO, we provide benchmarking figures to ensure roles are compensated fairly for their relative responsibility and seniority.
For more information
To find out more about the benchmarking data offer, the cost and how you can get access, or for any other questions about Employer Link and the National Heads of HR Network, please contact [email protected].